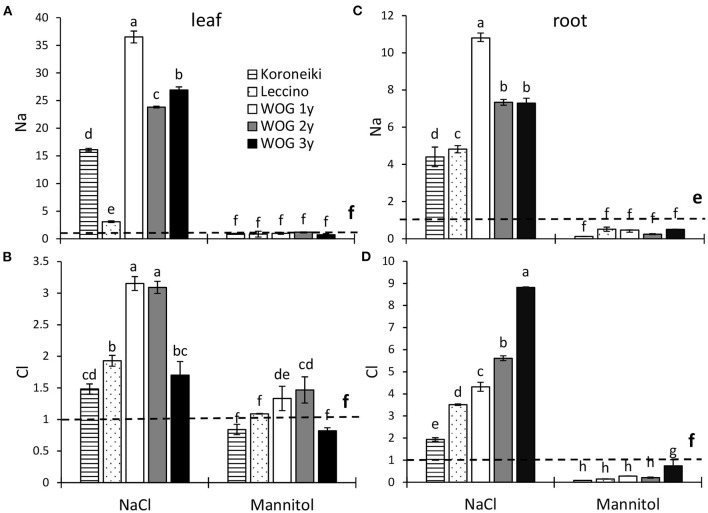
Figure 1.
The relative contents of leaf Na+ (A), leaf Cl− (B), root Na+ (C), and root Cl− (D) ions of olive after exposure to NaCl or mannitol. Controls are normalized to the value 1. Columns marked with different letters are statistically significantly different (p ≤ 0.05). The bars represent mean ±SD, n = 3. Raw data are presented in Supplementary Tables 2, 2a. SD, standard deviation.

