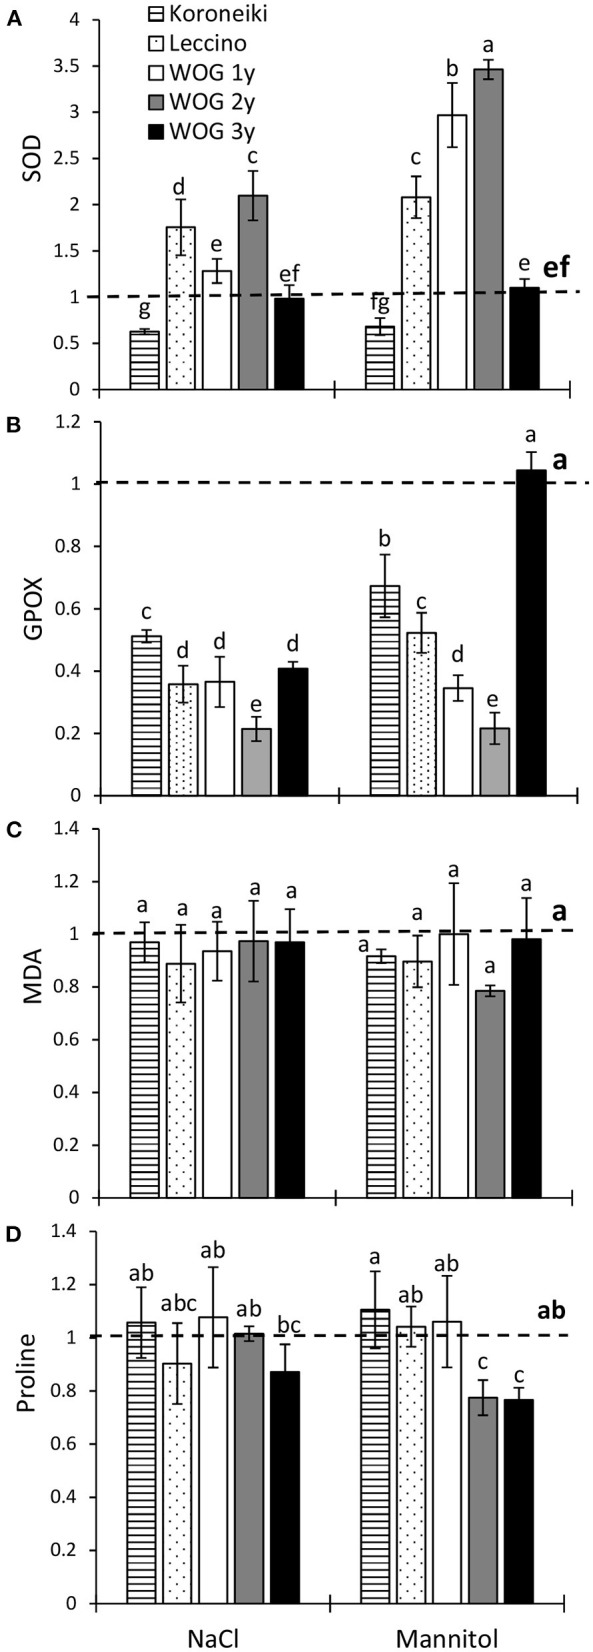
Figure 3.

The relative activity of superoxide dismutase (SOD) (A) and guaiacol peroxidase (GPOX) (B), relative contents of malondialdehyde (MDA) (C)and of proline (D) in olive leaves after exposure to NaCl or mannitol. Controls are normalized to the value 1. Columns marked with different letters are statistically significantly different (p ≤ 0.05). The bars represent mean ±SD, n = 3. Raw data are presented in Supplementary Table 3. SD, standard deviation.
