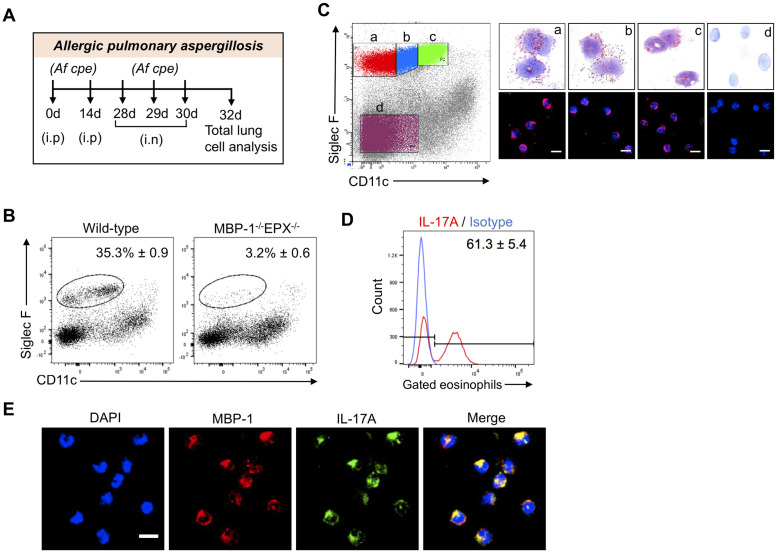
Fig 1. Production of IL-17 by pulmonary eosinophils in mice with allergic aspergillosis.
(A) Schematic of allergic pulmonary aspergillosis model. Mice were sensitized intraperitoneally (i.p.) with 250 μg of A. fumigatus crude protein extract (Af cpe) on days 0 and 14. Two weeks later, mice received 3 daily intranasal (i.n.) challenges with 25μg of Af cpe. Two days after the 3rd challenge, the mice were euthanized, single cell lung suspensions were prepared, and analyzed for eosinophils and cytokines by flow cytometry with intracellular staining (ICS). (B) Lung eosinophil recruitment. Allergic aspergillosis was established in wild-type C57BL/6 and MBP-1-/-EPX-/- and single cell lung suspensions were made as in Fig 1A. Lung eosinophils were analyzed by using cell surface markers (Siglec F/CD11c) after gating for live, CD45+ cells. Plot is representative of 2 independent experiments, each containing 5 mice. (C) Sorted eosinophil subpopulations. As in Fig 1B except subpopulations of Siglec F+ lung cells were gated and sorted according to level of expression of CD11c. As a control, a subpopulation of Siglec F- cells was also sorted. Sorted cells were analyzed by light microscopy after Diff-Quik staining, and by immunofluorescence after staining for the eosinophilic cytoplasmic granule marker, MBP and the nuclear marker, DAPI. Representative of 2 independent experiments, each containing 5 mice. (D) Intracellular cytokine staining (ICS). As in Fig 1B, except mice were treated with monensin intraperitoneally at 48 hours post-challenge to block cytokine secretion. Six hours following monensin treatment, mice were euthanized and lung single cells were prepared. Eosinophil IL-17 production was determined by ICS. Histograms show the shift in signal intensity for each cytokine compared to isotype control. FACS plots are representative of 3 experiments, each with 4–5 mice per group. The means ± SE of IL-17-staining cells combining each mouse experiment are shown next to the histograms. (E) Confocal microscopy. Allergic pulmonary aspergillosis was modeled in C57BL/6 mice as in Fig 1A. Two days following the 3rd intranasal challenge, mice were euthanized and single cell lung suspensions were made. After staining for Siglec F and CD11c, the eosinophil population was enriched by sorting on a FACS. Cells were then permeabilized and stained intracellularly with anti-IL-17A (green), anti-MBP (red) and DAPI (blue). Merge: DAPI + MBP + IL-17A. Scale bar = 5μm. Images are representative of two independent experiments, each with three mice. Greater than 100 cells were examined in each experiment.

