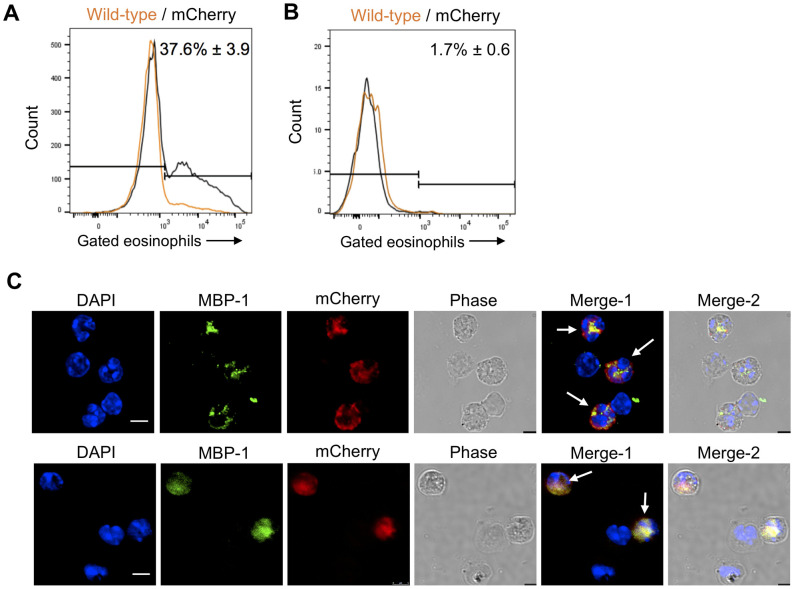
Fig 3. RORγt expression in lung eosinophils assessed using RORγt-mCherry reporter mice.
(A) Flow cytometry (allergy model). Allergic aspergillosis was induced in wild-type and RORγt-mCherry reporter mice as in Fig 1A. Eosinophils from lung cells were analyzed for expression of the mCherry signal. The plot demonstrates representative histograms of gated eosinophils from wild-type (orange) and RORγt-mCherry reporter (black) mice, respectively. The mean ± SE (n = 6 mice) of mCherry-positive eosinophils combining all the reporter mice experiments is shown next to the histogram. (B) Flow cytometry (untreated mice). Lungs were harvested from untreated wild-type and mCherry mice and their eosinophils were analyzed for mCherry expression. FACS plots are representative of 2 experiments, each with 5–6 mice per group. The mean ± SE (n = 11 mice) of mCherry-positive eosinophils combining all the reporter mice experiments is shown next to the histogram. (C) Confocal microscopy. Upper Panel: BAL cells were harvested from RORγt-mCherry reporter mice with allergic aspergillosis induced as in Fig 1A. Cells were permeabilized and stained for the eosinophil marker, MBP (green) and the nuclear marker, DAPI (blue). The mCherry reporter is in red. Merge-1: DAPI + MBP + mCherry, Merge-2: DAPI + MBP + mCherry + Phase. Scale bar = 5μm.Lower Panel: RORγt-mCherry reporter mice were infected with 5 x 10⁷ A. fumigatus conidia. Two days post infection, cells were harvested by BAL and permeabilized and stained as in Fig 3B. Merge-1: DAPI + MBP + mCherry, Merge-2: DAPI + MBP + mCherry + Phase. Scale bar = 5μm.

