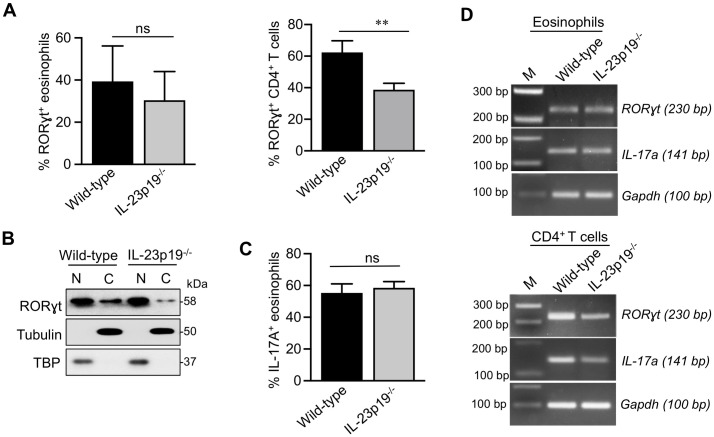
Fig 6. RORγt and IL-17 expression in lung eosinophils and CD4+ T cells from wild-type versus IL-23p19 deficient mice with allergic aspergillosis.
(A) RORγt expression by flow cytometry. Allergic aspergillosis was induced in wild-type and IL-23p19-/- mice as described in Fig 1A. Upper panel: Gated lung eosinophils were analyzed for RORγt staining by flow cytometry with ICS. The bar graphs show the percent RORγt+ eosinophils in wild-type and IL-23p19-/- mice in three separate experiments, each of which had 4–5 mice per group. Data are means ± SEM (ns, not significant). Lower panel: As in the upper panel except lung CD4+ T cells, gated based on positive staining for CD45, CD3 and CD4, were stained for RORγt. Data shown in the bar graphs are means ± SEM of an experiment with 4 mice/group (p <0.01). (B) Immunoblotting for RORγt. Allergic aspergillosis was induced in wild-type and IL-23p19-/- mice as shown in Fig 1A. Eosinophils were purified from total lung cells by FACS-sorting, separated into cytoplasmic (C) and nuclear (N) fractions and analyzed for RORγt by immunoblotting, as described in Fig 2C. TBP and α-Tubulin served as nuclear and cytoplasmic controls, respectively. (C) IL-17 expression by flow cytometry. Allergic aspergillosis was induced in wild-type and IL-23p19-/- mice as shown in Fig 1A. Lungs were harvested, and single cell preparations were made. Gated lung eosinophils were analyzed for IL-17 staining by flow cytometry with ICS. The bar graphs show the percent eosinophils in wild-type and IL-23p19-/- mice in two separate experiments, each of which had 4–5 mice per group. Data are means ± SEM (ns, not significant). (D) RT-PCR analysis. Allergic aspergillosis was induced in wild-type and IL-23p19-/- mice as shown in Fig 1A. Lung eosinophils (left panel) and CD4+T cells (right panel) were purified by flow-sorting following which their RNA was analyzed by RT-PCR for the expression of RORγt and IL-17a. Gapdh expression served as a loading control. M: DNA markers, as in Fig 5A.

