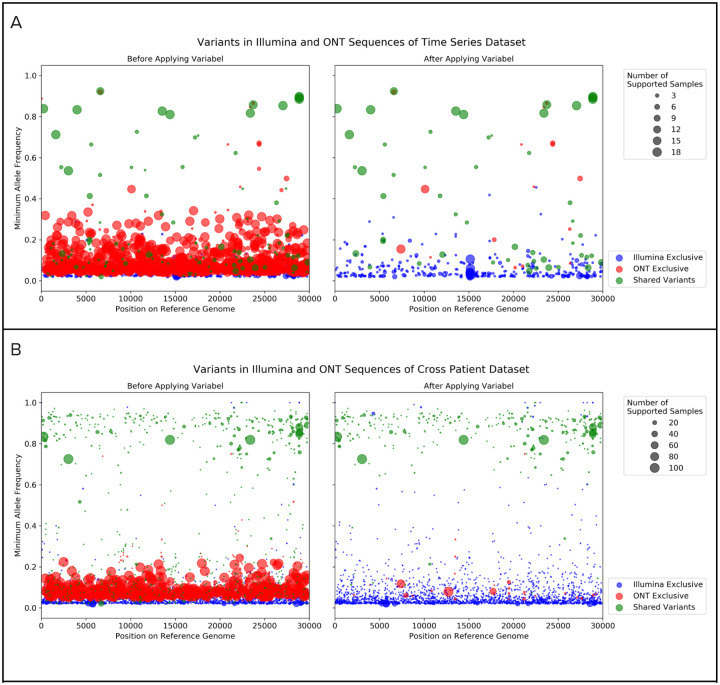
Figure 2. Variants called by lofreq with Illumina and ONT sequences before and after applying Variabel.
In each of the subfigures, the left plot shows the variant calls before applying Variabel and the right plot shows the variant calls after applying Variabel. The x-axis shows the position of the variant on the reference genome. The y-axis shows the minimum allele frequency of the variant found in multiple samples. Variants found in the Illumina sequences only are marked in blue, and variants found in the ONT sequences only are marked in red. Variants that are shared between both Illumina and ONT data are shown in green. The size of the dot represents the number of samples supporting the variant. a) Variant calls of the time series dataset. b) Variant calls of the cross patient dataset.

