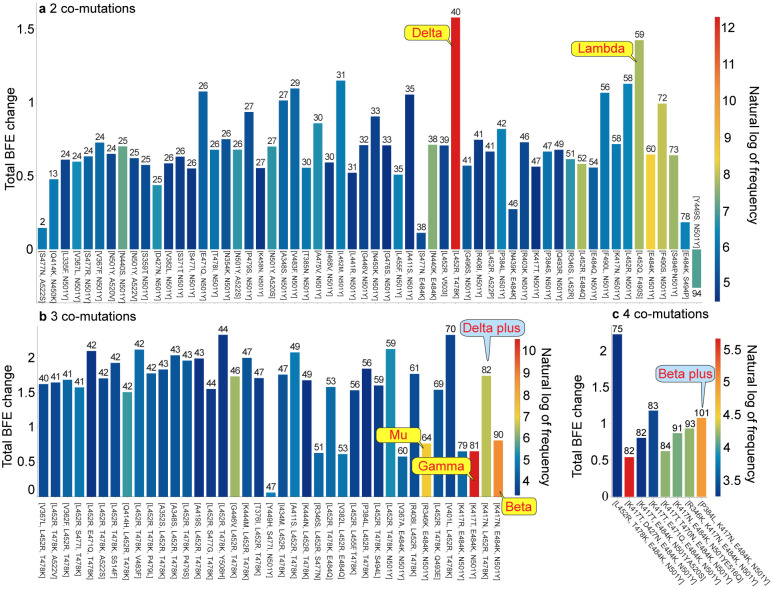
Figure 2:
Properties of RBD co-mutations. a Illustration of RBD 2 co-mutations with a frequency greater than 90. b Illustration of RBD 3 co-mutations with a frequency greater than 30. c Illustration of RBD 2 co-mutations with a frequency greater than 20. Here, the x-axis lists RBD co-mutations and the y-axis represents the predicted total BFE change of each set of RBD co-mutations. The number on the top of each bar is the AI-predicted number of antibody and RBD complexes that may be significantly disrupted by the set of RBD co-mutations, and the color of each bar represents the natural log of frequency for each set of RBD co-mutations. (Please check the interactive HTML files in the Supporting Information S2.2.4 for a better view of these plots.)

