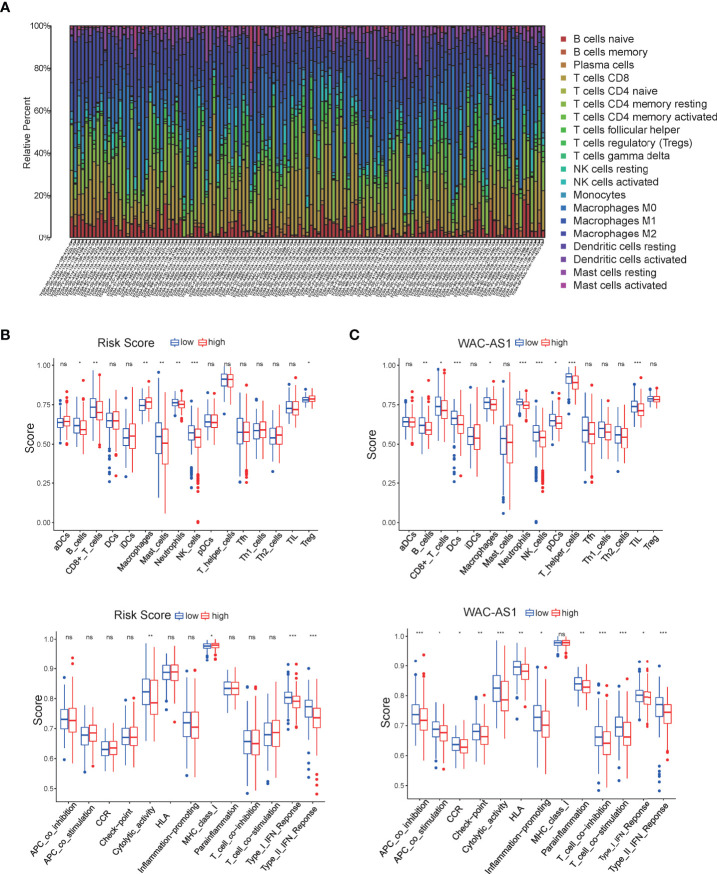
Figure 4.
Characterization of immune cell infiltration and immune-related functions. (A) Bar chart of the proportions for 22 immune cell types; (B) relationship of the risk score with immune cell infiltration and the immune response; (C) relationship of WAC-AS1 with immune cell infiltration and the immune response. ∗P < 0.05, ∗∗P < 0.01, ***p < 0.001; ns, no significance.

