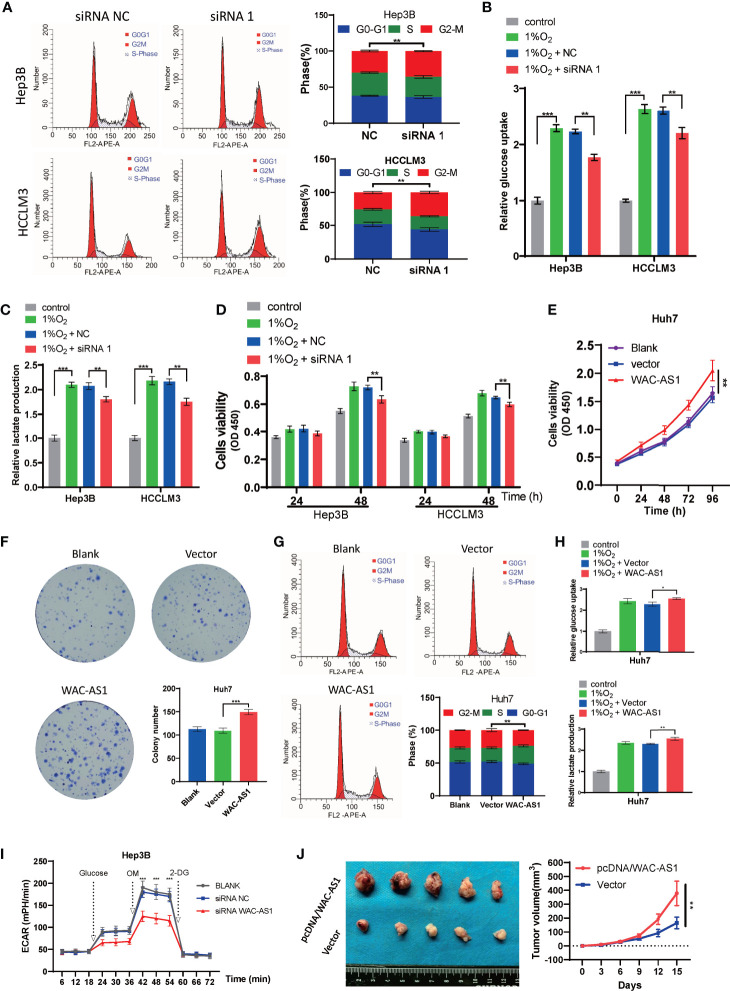
Figure 6.
The effect of WAC-AS1 on glycolysis and the cell cycle. (A) cell cycle analysis was used to detect the cell cycle distribution after transfection; (B) glucose uptake in Hep3B and HCCLM3 cells; (C) lactate production detected by the lactate assay kit; (D) CCK-8 assay for cell viability; (E) cell viability of Huh7 cells after overexpression of WAC-AS1; (F) representative images of plate colony formation in Huh7 cells; (G) cell cycle analysis of Huh7 cells; (H) glucose uptake and lactate production in Huh7 cells; (I) ECAR levels in Hep3B cells; (J) subcutaneous xenograft tumors and growth curve. ∗P < 0.05; ∗∗P < 0.01; ***p < 0.001.

