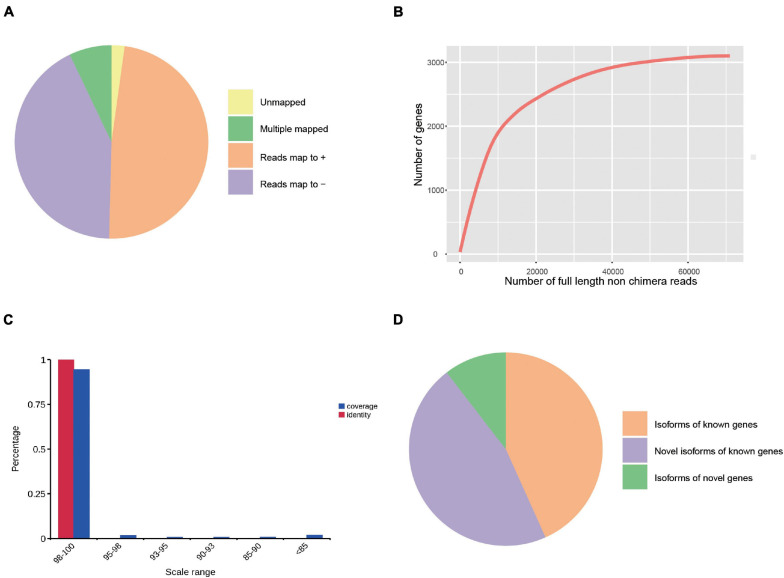
FIGURE 2.
Genome Mapping and Alignment Program (GMAP) analysis of SMRT sequencing. (A) GMAP mapping statistics of the corrected sequences. (B) Saturation curve of corrected sequences, x-axis represents numbers of full-length non-chimera (FLNC) reads, y-axis represents numbers of genes. (C) Range of mapping coverage and identity, x-axis represents the scale ranges, y-axis represents the percentages. (D) Classification of transcript isoforms identified.

