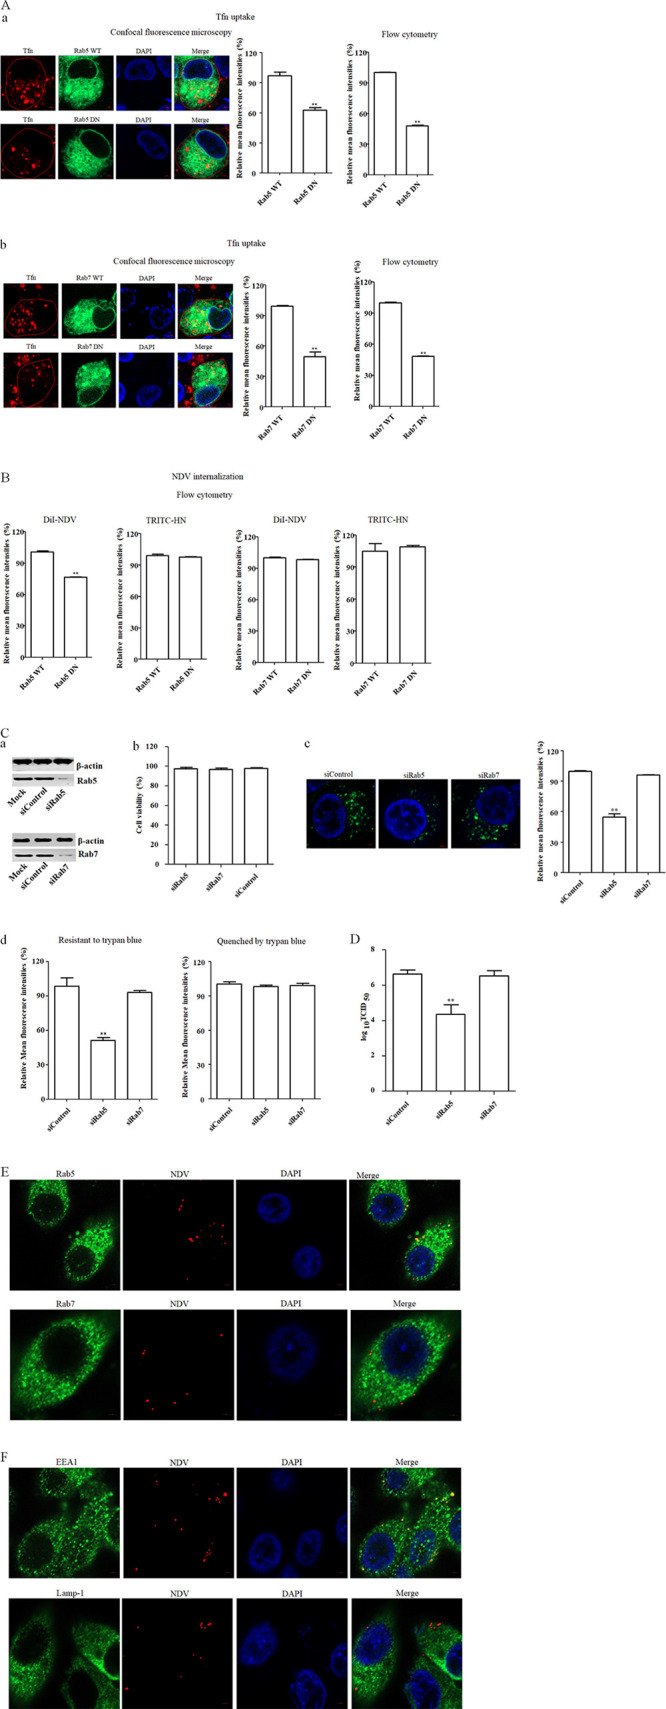
FIG 7.

Effects of Rabs on NDV infection. (A and B) Effects of Rab5 and Rab7 on Tfn uptake (A) and NDV internalization (B). HD11 cells transfected with plasmids expressing EGFP-tagged WT or DN Rab5 and Rab7 were incubated with 10 μg/ml Tfn, and DiI-labeled or unlabeled NDV F48E9 for 1 h at 4°C and then shifted to 37°C for 1 h. After a wash with low-pH buffer, the red fluorescence of Tfn (subpanels a and b in panel A), DiI-labeled NDV (B), and HN protein (B) on the cell surface was determined as described above. (C) Rab5 knockdown reduced the internalization of NDV. HD11 cells were transfected with siRNA targeting Rab 5 (siRab5), Rab7 (siRab7), or siControl. The effect of siRNA knockdown of Rab5 and Rab7 expression was determined by Western blotting (a). Cell viability upon siRab5, siRab7, and siControl transfection was assessed, as described in the text (b). At 48 h posttransfection, an internalization assay was performed with DiOC-labeled NDV F48E9 as described above. The green fluorescence of DiOC that was resistant and quenched by trypan blue was determined by confocal fluorescence microscopy (c) and flow cytometry (d), respectively. (D) Rab 5 knockdown reduced the replication of NDV. HD11 cells were transfected with siRab5, siRab7, or siControl. At 48 h posttransfection, the cells were infected with NDV F48E9 at an MOI of 0.1, and the viral titers in the culture supernatants of infected cells were determined at 18 hpi. (E) Colocalization of NDV with Rab5. HD11 cells were incubated with NDV F48E9 at an MOI of 10 at 4°C for 1 h and then shifted to 37°C for 1 h. Cells were then fixed and reacted with anti-Rab5 antibody, anti-Rab7 antibody, and NDV HN antibody, respectively, and visualized by confocal microscopy. (F) Colocalization of NDV with the early endosome marker EEA1. HD11 cells were incubated with NDV F48E9 at an MOI of 10 at 4°C for 1 h and then shifted to 37°C for 1 h. The cells were fixed and reacted with anti-EEA1 antibody, anti-Lamp-1 antibody, and NDV HN antibody, respectively, and visualized by confocal microscopy. The bars represent means ± the SD. Data were analyzed by using the Student t test (*, P < 0.05; **, P < 0.01).
