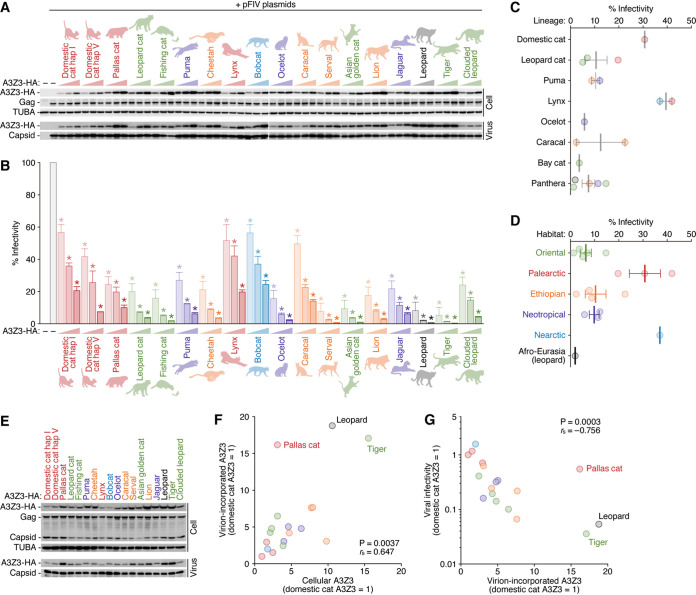
FIG 3.
Antiviral activities of 18 feline A3Z3 proteins. (A and B) HA-tagged expression plasmids for feline A3Z3 (0, 100, 200, and 400 ng) and the three plasmids to produce the vif-deficient FIV-based reporter virus (FIV plasmids: pFP93 [200 ng], pTiger-luc [150 ng], and pMD.G [50 ng]) were cotransfected into HEK293T cells. (A) Western blotting. Representative results of three independent experiments are shown. Gag, FIV Gag precursor. (B) FIV reporter assay. FIV infectivity is shown as the percentage of the value without A3Z3. *, P < 0.05 by Student’s t test versus the value without A3Z3. The assays were independently performed in triplicates, and the averages with SEMs are shown. (C and D) Associations of the antiviral activity of feline A3Z3 with the lineage and the habitat of felids. The data of the viral infectivity at 200 ng of the HA-tagged feline A3Z3 expression plasmid shown in panel B (the middle column of each felid) were resorted based on the lineage (C) and the habitat (D) of each felid. Each classification is based on the information summarized in Table 1. For domestic cat, the average value of hap I and hap V is used. Each dot represents the value from each species, and the vertical bars indicate the averages with SEMs. (E) Western blotting. The samples at 200 ng of the HA-tagged feline A3Z3 expression plasmid shown in panel A (the middle column of each felid) were reblotted for the comparison. Representative results of at least three independent experiments are shown. Gag, FIV Gag precursor. (F and G) Correlations between the levels of feline A3Z3 proteins and viral infectivity. (F) Correlation between the levels of A3Z3 proteins in the cells (x axis) and those in the virions (y axis). The levels of cellular A3Z3 and virion-incorporated A3Z3 were normalized to the levels of TUBA and viral capsid, respectively. (G) Correlation between the levels of A3Z3 proteins in the virions (x axis) and viral infectivities (y axis). In panels F and G, the values of domestic cat hap I are set to 1. Each dot represents the value from each species. Each parameter was extracted from the data at 200 ng of the HA-tagged feline A3Z3 expression plasmid shown in panels A and B (the middle column of each felid). The parameters were extracted from the three independent experiments, and the average values are plotted.

