
FIG 7.
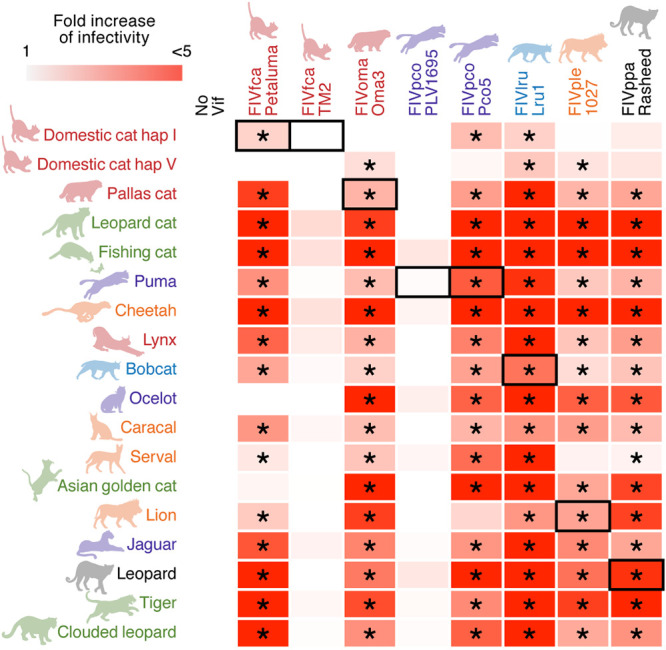
A heat map of antiviral activity of 18 feline A3Z3s and their counteraction by eight FIV Vifs. The data shown in Fig. 7 are summarized as a heat map. *, P < 0.05 by Student’s t test versus “no Vif.” The results from the interplay between FIV and its natural host are indicated by black outlines.