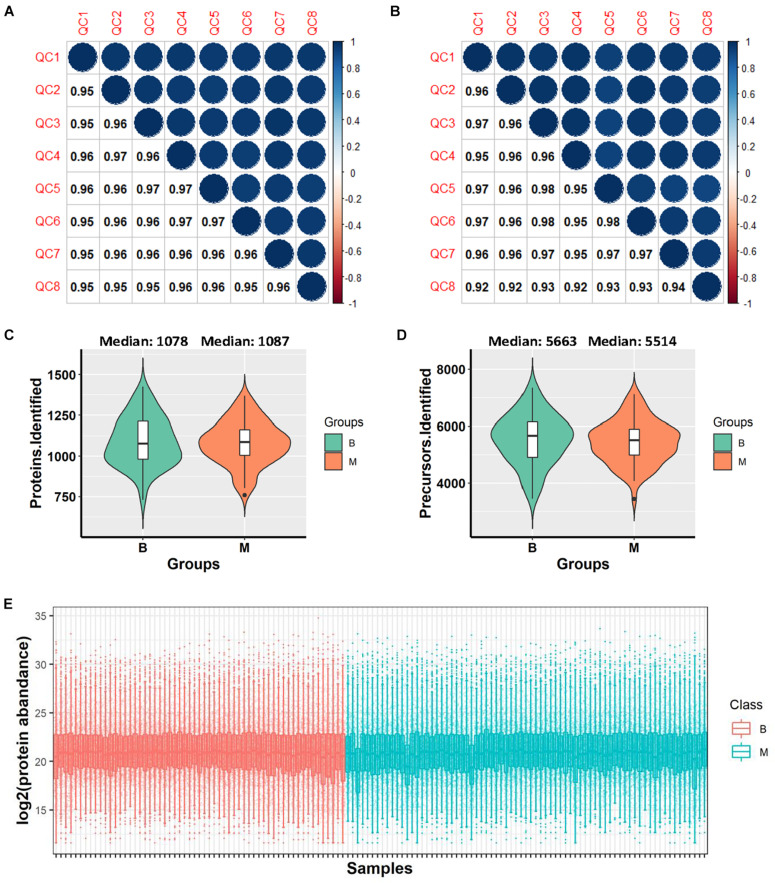
FIGURE 2.
Data quality evaluation. (A) Pearson correlation of 8 HeLa cell lysate samples in all batches for evaluation of the reproducibility of mass spectrometry. (B) Pearson correlation of 8 repeat-tested urine samples in all batches for evaluation of the reproducibility of methodology. (C) Violin plot of protein identification numbers in benign and malignant groups. (D) Violin plot of precursor identification numbers in benign and malignant groups. (E) Box plot of protein abundance in each sample. *B, benign group; M, malignant group.

