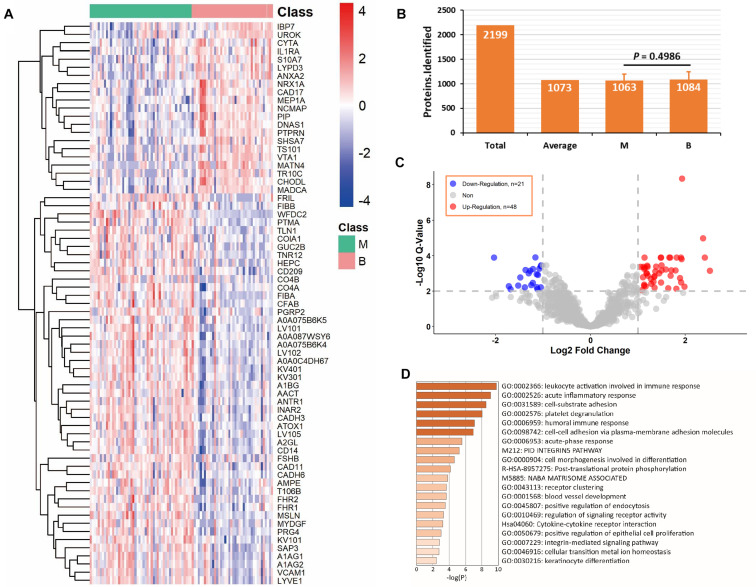
FIGURE 3.
Analysis of differentially expressed proteins in C1 dataset. (A) Differentially expressed proteins in benign and malignant groups with q-value < 0.01 and absolute log2 fold change > 1. (B) Average protein identification numbers in each sample, benign and malignant groups of C1 dataset. (C) Volcano plot of down-regulation and up-regulation in malignant group. (D) Pathway analysis of the differentially expressed proteins using Metascape web-based platform. *B, benign group; M, malignant group.

