. 2021 Sep 9;10:e69199. doi: 10.7554/eLife.69199

Figure 3. Wnt5a regulates APP expression through changing its intracellular trafficking.

(A) Co-immunoprecipitation (co-IP) of Wnt5a-Myc with full-length proteins mAPP-flag or mAPP-delatCRD-flag. The tagged proteins were co-expressed in HEK293T cells and immunoprecipitated with ant-flag and anti-Myc antibodies. Wild-type mAPP could pull down Wnt5a and vice versa, while mAPP lacking the CRD domain showed impaired ability to pull down Wnt5a, even with higher protein levels compared to wild-type mAPP in the input. (B) mAPP localization after 4 hr PBS/BSA or Wnt5a treatment. Immunofluorescence for APP (red), Rab5 (early endosome marker, green), Golgin97 (TGN marker, green), and Lamp1 (lysosome marker, green) revealed mAPP localization in different intracellular compartments. The inset showed zoomed in images of the area in the white box and arrows indicated the overlap of mAPP with respective cellular compartment markers. Scale bar = 10 µm. (C–E) Quantification of the overlap of mAPP with early endosome (C), TGN (D) or lysosome (E), respectively, after Wnt5a treatment. (n=33–55 cells, t-test). (F) Western blots of mAPP and Actin on the lysates of DIV7 primary cultured cortical neurons showed that mAPP protein expression level was altered after Wnt5a treatment. (G) Quantification of the western blots results for fig F. (n=three biological independent repeat, t-test). (H) qPCR results showed that mApp mRNA expression was not affected after Wnt5a treatment on DIV7. App-/- mice derived primary neurons were used as a negative control. (n=three biological independent repeat, one-way ANOVA). (I and J) Western blots for APP showed that the lysosome inhibitor Bafilomycin-A (J) could rescue Wnt5a-induced mAPP reduction compared with control groups (I). (K and L) Quantification of the western blots result for figure I and J. (n=three biological independent repeat, t-test). Bars represent the mean ± S.E.M. Samples collected from at least two independent experiments. *p<0.05, **p<0.01. .

Figure 3—source data 1. Co-immunoprecipitation (co-IP) of Wnt5a-Myc with full-length proteins mAPP-flag or mAPP-delatCRD-flag.
Figure 3—source data 2. Western blots for mAPP and Actin after Wnt5a treatment on DIV7 primary cortical neurons.
Figure 3—source data 3. Western blots for mAPP and Actin after Wnt5a treatment on DIV7 primary cortical neurons.
Figure 3—source data 4. Western blots for mAPP and Actin after adding Bafilomycin followed by Wnt5a treatment on DIV7 primary cortical neurons.

Figure 3.

Figure 3—figure supplement 1. Rapid turnover of fl-mAPP in culture mouse primary cortical neurons.

Figure 3—figure supplement 1.

(A and B) Western blots for the time course (0.5 hr, 1 hr, 2 hr, 4 hr) of fl-mAPP expression after Cycloheximide (50 µg/ml, A) or DMSO (0.05%, B) treatment at DIV7. (C and D) Quantification of fl-mAPP expression after Cycloheximide (C) or DMSO treatment (D). (n=three biological independent repeat, one-way ANOVA). Bars represent the mean ± S.E.M. **p<0.01, ****p<0.0001.
Figure 3—figure supplement 1—source data 1. Western blots for time course (0.5 hr, 1 hr, 2 hr, 4 hr) of fl-mAPP expression after Cycloheximide (50 µg/ml) treatment on DIV7 primary cortical neurons.
Figure 3—figure supplement 1—source data 2. Western blots for time course (0.5 hr, 1 hr, 2 hr, 4 hr) of fl-mAPP expression after DMSO (0.05%), treatment on DIV7 primary cortical neurons.
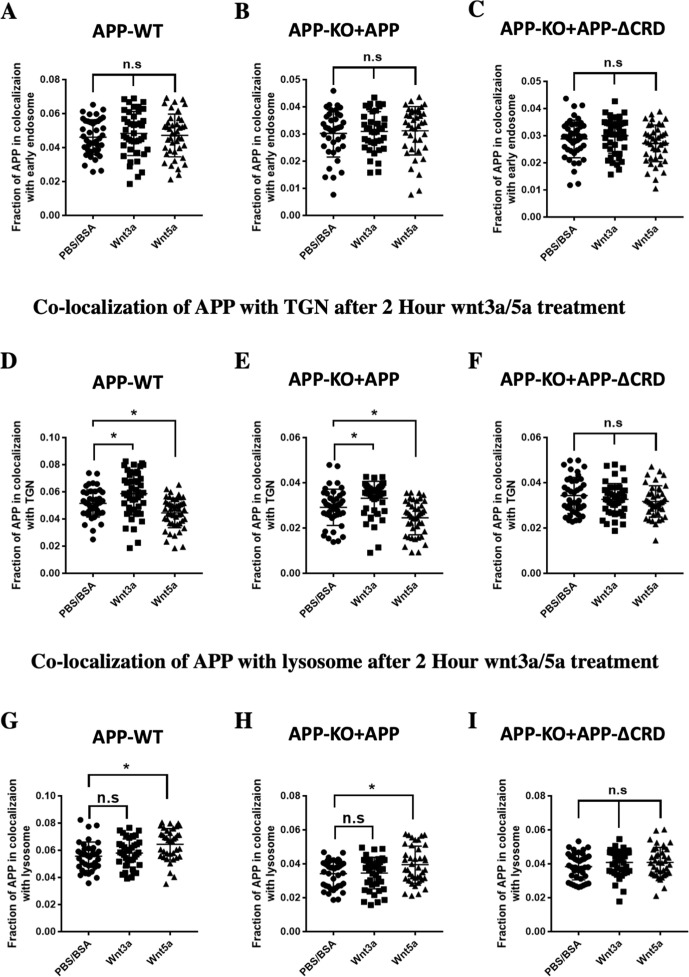
Figure 3—figure supplement 2. APP overlap with early endosome, TGN and lysosome after Wnt3a/5a treatment.

Figure 3—figure supplement 2.

(A–C) Quantification of the overlap between mAPP and early endosome 2 hr after Wnt3a/5a treatment in DIV7 cultured cortical primary neurons: APP-WT groups (A), APP-KO rescued with APP groups (B) and APP-KO rescued with APP-ΔCRD groups (C). (n=38–44 cells, one-way ANOVA). (D–F) Quantification of the overlap between mAPP and TGN 2 hr after Wnt3a/5a treatment in DIV7 cultured cortical primary neurons: APP-WT groups (D), APP-KO rescued with APP groups (E) and APP-KO rescued with APP-ΔCRD groups (F). (n=43–48 cells, one-way ANOVA). (G–I) Quantification of the overlap between mAPP and lysosome 2 hr after Wnt3a/5a treatment in DIV7 cultured cortical primary neurons: APP-WT groups (G), APP-KO rescued with APP groups (H) and APP-KO rescued with APP-ΔCRD groups (I). (n=38–40 cells, one-way ANOVA). Bars represent the mean ± S.E.M. Samples collected from at least two independent experiments. *p<0.05.
Figure 3—figure supplement 3. Wnt3a/5a treatment barely affect APP overlap with recycling endosome.

Figure 3—figure supplement 3.

(A–C) Quantification of the overlap between mAPP and recycling endosome 4 hr after Wnt3a/5a treatment in DIV7 cultured cortical primary neurons: APP-WT groups (A), APP-KO rescued with APP groups (B) and APP-KO rescued with APP-ΔCRD groups (C). (n=41–49 cells, one-way ANOVA). (D–F) Quantification of the overlap between mAPP and recycling endosome 2 hr after Wnt3a/5a treatment in DIV7 cultured cortical primary neurons: APP-WT groups (D), APP-KO rescued with APP groups (E) and APP-KO rescued with APP-ΔCRD groups (F). (n=42–56 cells, one-way ANOVA). Bars represent the mean ± S.E.M. Samples collected from at least two independent experiments.
Figure 3—figure supplement 4. Rab5 Golgin97 and Lamp1 expression after Wnt3a/5a treatment.

Figure 3—figure supplement 4.

(A) Western blots for fl-mAPP, Rab5, Golgin97, Lamp1, and Actin 4 hr after Wnt3a/5a treatment at DIV7. (B–E) Quantification of the western blots results for figure (A) fl-mAPP (B), Rab5 (C), Golgin97 (D), and Lamp1 (E). (n=three biological independent repeat, one-way ANOVA). Bars represent the mean ± S.E.M. Samples collected from at least two independent experiments. *p<0.05, **p<0.01.
Figure 3—figure supplement 4—source data 1. Western blots for fl-mAPP, Rab5, Golgin97, and Lamp1 after 4 hr of Wnt3a/5a treatment on DIV7 primary cortical neurons.
Figure 3—figure supplement 5. Time course of fl-mAPP after Wnt3a/5a treatment.

Figure 3—figure supplement 5.

Representative western blots for the time course (0.5 hr, 1 hr, 2 hr, 4 hr) of fl-mAPP expression after PBS/BSA (ctrl) and Wnt3a/5a treatment at DIV7. Relative expression value of the protein bands normalized to the respective actin were also shown.
Figure 3—figure supplement 5—source data 1. Representative western blots for the time course (0.5 hr, 1 hr, 2 hr, 4 hr) of fl-mAPP expression after PBS/BSA (ctrl) and Wnt3a/5a treatment at DIV7.