. 2021 Sep 9;10:e69199. doi: 10.7554/eLife.69199

Figure 6. Cysteine-Rich Domain is critical for APP to regulate neurite outgrowth at DIV3.

(A) Schematic of a primary neuron. Colored lines indicate axonal or dendritic branch tips which were quantified. Yellow indicates the Axon Initial Segment (AIS) marked with Ankry G in experiments. (B) Representative confocal images for GFP (green) and AnkG (red) immunostaining at DIV3 on primary cultured cortical neurons of the four genotypes examined: mAPP wild type, mAPP–KO, and mAPP–KO rescued with mAPP or CRD-mutant mAPP. Transfected plasmids containing GFP alone, mAPP-flag-GFP or mAPPΔCRD-flag-GFP, which was performed at the onset of cell seeding. Scale bar = 50 µm. (C–E). Quantification of three parameters on these four genotypes at DIV3: the total axon length (the main axonal process and the branches deriving from the main process, C), the longest axonal length (D), the total axonal branch tips (E), primary branch tips (F) and secondary branch tips (G). (n=59–70 cells, one-way ANOVA). Bars represent the mean ± S.E.M. Samples collected from at least two independent experiments. *p<0.05, **p<0.01 ***p<0.001.

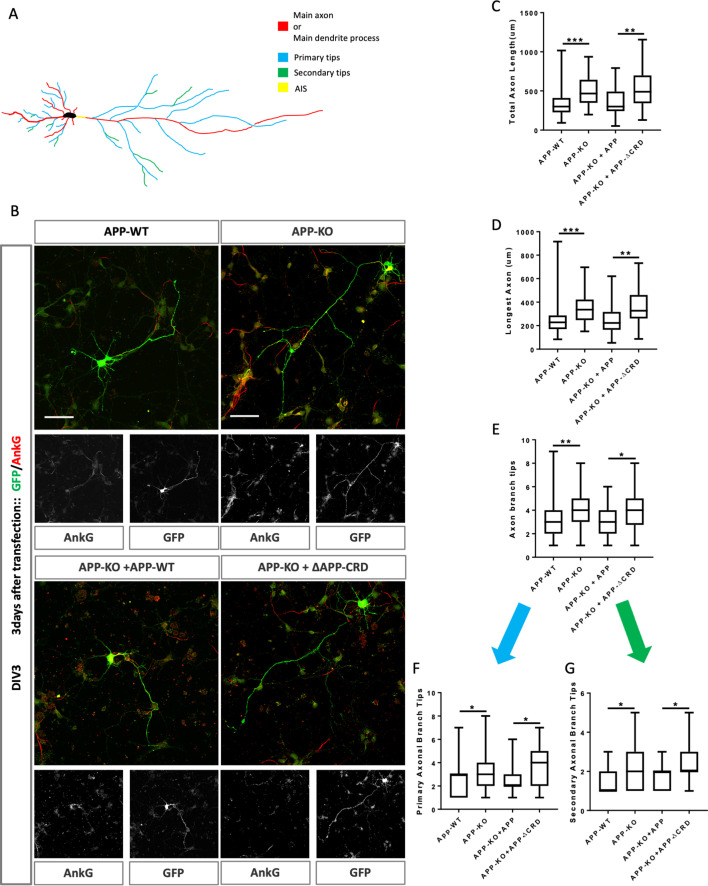
Figure 6.

Figure 6—figure supplement 1. Neurite outgrowth is unaffected in APP knock out neurons at DIV2.

Figure 6—figure supplement 1.

(A–C) Quantification of the total axon length (A), the longest axon length (B) and axon branch tips (C) from DIV2 cultured primary cortical neuron. (D–F) Quantification of the total dendrite length (D), the longest dendrite length (E) and dendrite branch tips (F) from DIV2 cultured primary cortical neuron. Bars represent the mean ± S.E.M., n=30–38 cells, t-test. Samples collected from at least two independent experiments.
Figure 6—figure supplement 2. Analysis of dendritic outgrowth and axon complexity index at DIV3.

Figure 6—figure supplement 2.

(A–C) Quantification of the total dendrite length (A), the longest dendrite length (B) and dendrite branch tips (C) from DIV3 cultured primary cortical neurons on APP-WT groups, APP-KO groups, APP-KO rescued with APP groups and APP-KO rescued with APP-ΔCRD groups. (n=51 cells, one-way ANOVA). (D) Axon complexity Index (ACI) analysis of axon at DIV3 on each group (n=59–69 cells, one-way ANOVA). (E–G) Quantification of the main dendrite process (E), the primary (F) and secondary (G) dendrite process numbers on each group (n=51 cells, one-way ANOVA). Bars represent the mean ± S.E.M. Samples collected from at least two independent experiments.