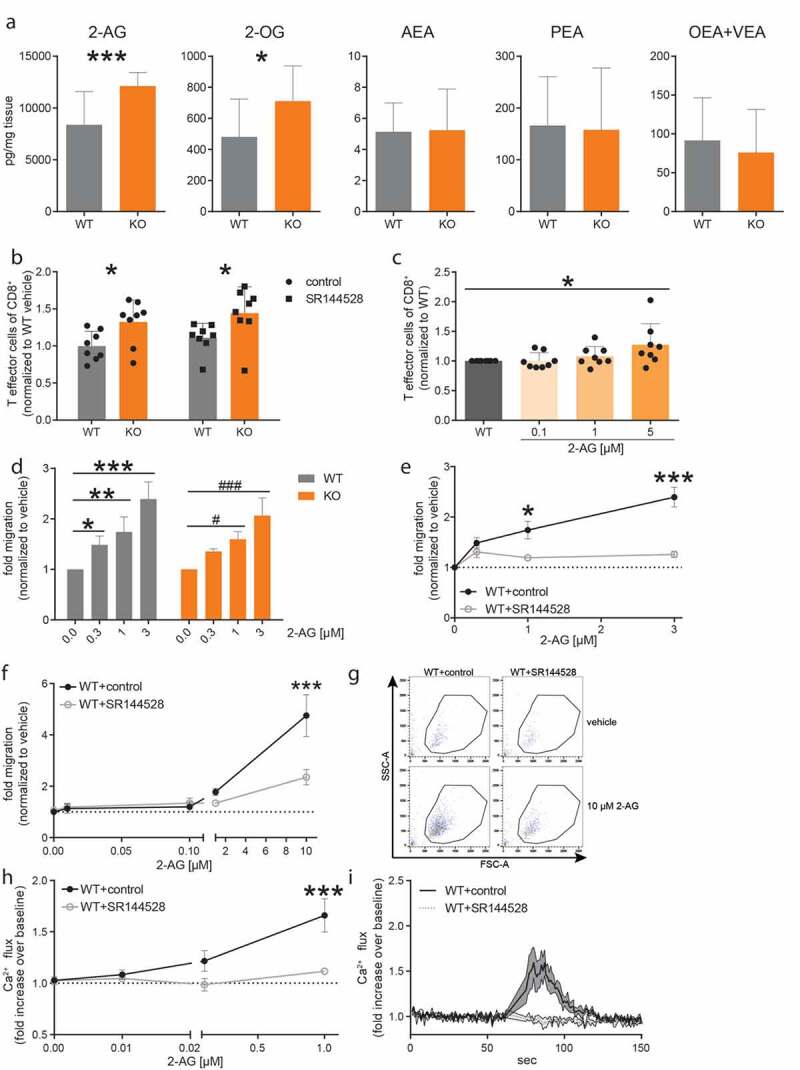
Figure 4.

2-AG shifts CD8+ T cells toward a T effector phenotype and activates eosinophils in vitro.
(a) Tumors were snap frozen in liquid nitrogen and the tissue homogenate was subsequently analyzed by mass spectrometry. Graphs show lipid levels of MGL WT and KO tumors (n ≥ 12). (b) T cells were isolated from the spleen of WT and MGL KO mice and incubated for 3 days with anti-CD3/CD28-antibodies as well as pre-treated (30 min) with 1 µM of the CB2 antagonist SR144528 or control (<0.05% EtOH). (c) T cells isolated from WTs were treated with anti-CD3/CD28-antibodies and with increasing concentrations of 2-AG (or vehicle [<0.05% DMSO]). T cell differentiation was detected by flow cytometry. Data show means + SD from three independent experiments normalized to CD44 expression of WT vehicle-treated T cells. n = 8. (d) CD8+ T cells were isolated from spleens of MGL WT and KO mice and were allowed to migrate toward different concentrations of 2-AG or vehicle in a Transwell plate and counted by flow cytometry. n = 3. (e) CD8+ T cells of WT mice were additionally pre-treated with 1 µM of SR144528 for 10 min (or control). Statistical difference of migrated (toward 2-AG) CD8+ T cells WT+control compared to WT+SR144528. (f) Bone marrow-derived eosinophils (BMDEs) from WT (C57BL/6J) mice were allowed to migrate toward different concentrations of 2-AG or vehicle in a Transwell plate and enumerated by flow cytometry. The BMDEs were incubated with 1 µM of SR144528 (or control). Data are shown as means ± SEM from three independent experiments. n = 3–4. (g) Representative dot plots of migrated BMDEs. Numbers indicate BMDEs counted for 60 s on high with flow cytometry. (h) BMDEs from WT mice were labeled with Fluo-3-AM and flow cytometry was used to detect changes in the Ca2+ flux. BMDEs were pre-treated with 1 µM SR144528 or control. Subsequently, BMDEs were stimulated with different concentrations of 2-AG or vehicle only. Results represent fold increase in Ca2+ flux over baseline. Data are shown as means ± SEM from three individual experiments. n = 3–4. Statistical difference of WT+control vs. 1 µM SR144528 treated BMDEs. (i) Time course of Ca2+ flux in BMDEs stimulated with 1 µM 2-AG. BMDEs were either pretreated with 1 µM SR144528 or control. After baseline measurement (60 s), 2-AG was added to induce Ca2+ flux. Data are shown as means ± SEM or + SD from three independent experiments. n = 3–4. Statistical differences were assessed by using two-way ANOVA with Tukey’s or Sidak’s post hoc test, student’s t-test and one-way ANOVA with Dunnett’s multiple comparison test. *p < .05; **p < .01, ***p < .001.
