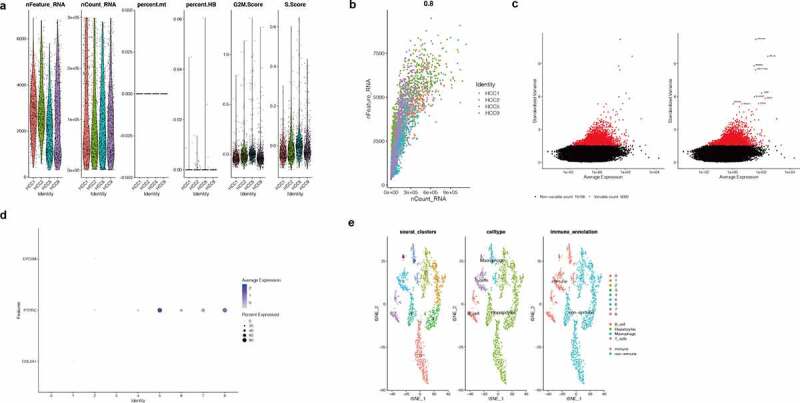
Figure 7.

Single-cell quality control and dimension reduction cluster analysis. (a)The total gene expression of each cell fluctuated from 0 to 300,000. In addition, both the number of gene expressions in each cell and the sum of gene expression in the 4 samples of HCC were relatively similar. At the same time, we found that the percentage of mitochondrial genes and red blood cell genes was less than 3%. Moreover, the G2M and S phase scores of the cell cycle were basically similar in the four HCC samples, suggesting that the cell cycle had no significant impact on the subsequent analysis. (b)The number of genes in the cells was positively correlated with the sum of gene expression, with a correlation of 0.8. In addition, the overall trend of the four samples was similar, suggesting that there was no significant difference between the number of cells and the number of genes detected in the four samples. (c)3,000 hypervariable genes from all the genes shown in red and the top 10 hypervariable genes. They were JOHAIN, IGLL5, REG3A, HIST1H40, ORP, ELK2AP, SSR4, SPARO, MS4A1, and OOL5. (d)We found that marker genes of immune cells in Cluster 5, 6, 7, and 8, especially PTPRC, were highly expressed, suggesting that 5, 6, 7, and 8 might be immune cells. (e)The results of the cell cluster, cell “singlerR” annotation, and immune and nonimmune cells and the results of immune cells obtained by immune cell marker gene annotation were consistent with those obtained by singleR package annotation
