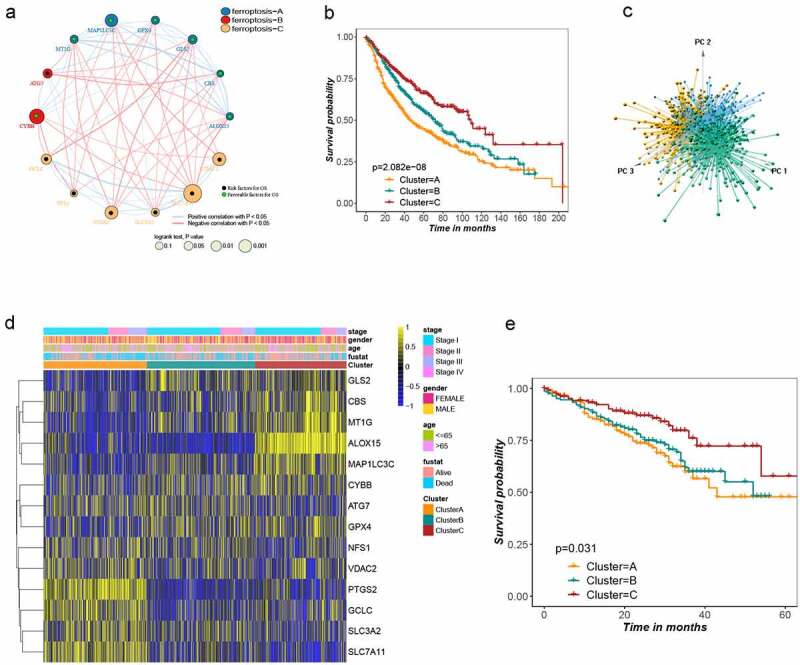
Figure1.

Landscape of the ferroptosis and biological characteristics of ferroptosis subtypes in lung adenocarcinoma. (a) Interaction of ferroptosis related genes in LUSD. Blue, red and yellow represent ferroptosis A, B and C, respectively. The size of the circle represents the impact of each ferroptosis gene on the prognosis, the P value calculated by log-rank test. Green dots in the circle represent protective factors and black dots represent risk factors. Links between genes represent their interactions, blue lines represent positive correlations, red lines represent negative correlations, and the thickness of the lines represents the strength of the correlation between them. (b) Survival analysis of three ferroptosis subtypes in all patients, Kaplan-Meier survival curve showed significant differences among the three subtypes (log-rank test, P < .001). (c) Principal component analysis of 14 ferroptosis genes in all lung adenocarcinoma cohorts identified three distinct subtypes. (d) Unsupervised clustering of 14 ferroptosis genes in all lung adenocarcinoma cohorts. Tumor stage, gender, age, survival status and cluster were used as patient annotations. Yellow and blue represent high and low expression of ferroptosis genes respectively. (e) Kaplan–Meier curves for overall survival (OS) of GSE72094 cohort with the ferroptosis classes (log-rank test, P = .031)
