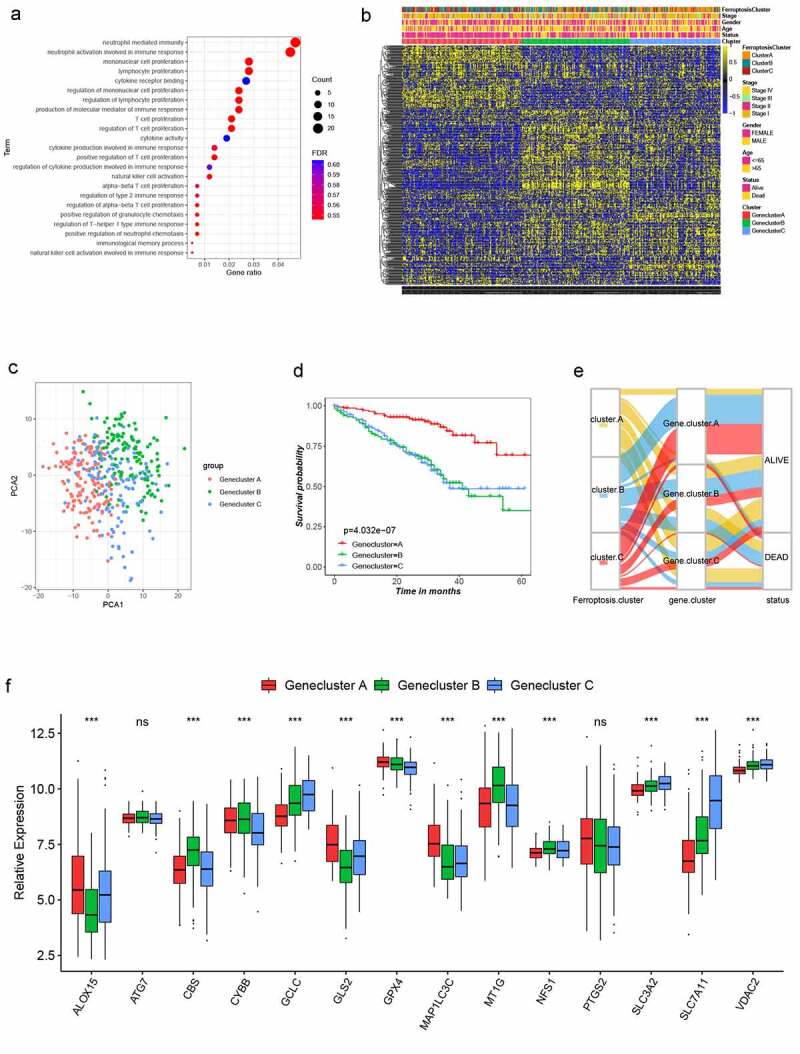
Figure 3.

Landscape of biological characteristics of Ferroptosis gene cluster. (a) GO enrichment analysis of DEGs. The size of bubbles represents the amount of gene enrichment, and the depth of color represents the FDR value. DEGs, differentially expressed protein-coding genes; GO, Gene Ontology; FDR, False Discovery Rate. (b) Unsupervised clustering of 470 DEGs in the GSE72094 LUSD cohort. Ferroptosis Cluster, tumor stage, gender, age, survival status and cluster were used as patient annotations. Yellow and blue represent high and low expression of ferroptosis genes respectively. (c) Principal component analysis of 470 DEGs in the GSE72094 LUSD cohort identified three distinct Gene clusters. (d) Survival analysis of three Gene clusters in the GSE72094 LUSD cohort, Kaplan-Meier survival curve showed significant differences among the three gene clusters (log-rank test, P < .001). (e) Alluvial diagram showing the changes of Ferroptosis cluster, gene cluster and status. (f) Expression of 14 ferroptosis genes in three Gene clusters. The line in the box represents the median value and the asterisk represents the P value (*P < .05; **P < .01; ***P < .001). The statistical differences among the three clusters were analyzed by one-way ANOVA test
