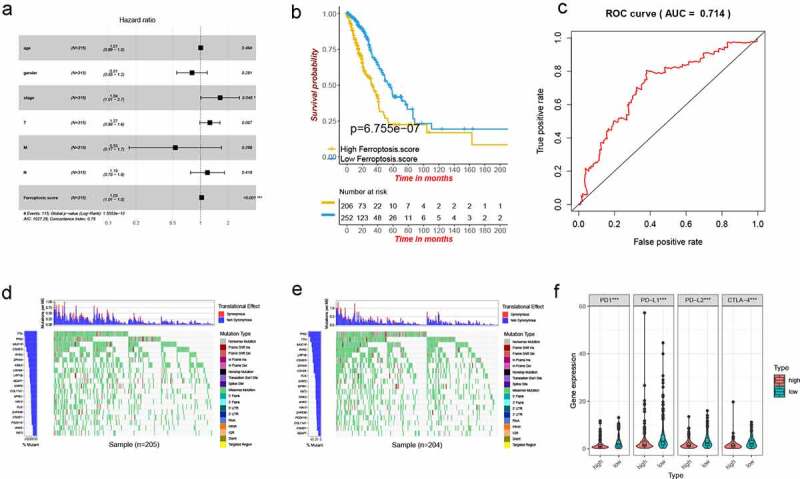
Figure 5.

Characteristics of ferroptosis score in TCGA cohort and tumor somatic mutation. (a) Forest map of ferroptosis score and other clinicopathological parameters. (b) Kaplan–Meier plot of overall survival by ferroptosis score groups for patients in the TCGA cohort (P < .001, Log-rank test). (c) The predictive value of ferroptosis score in older patients with LUSD. AUC 0.714. (d-e) The waterfall plot showing the differences of tumor somatic mutation landscape between low and high ferroptosis score groups. (d) High ferroptosis score group. (e) Low ferroptosis score group. (f) Differential expression of immune checkpoint related molecules in high and low ferroptosis score groups. P values were showed as: ***, P < .001
