
Figure 1.
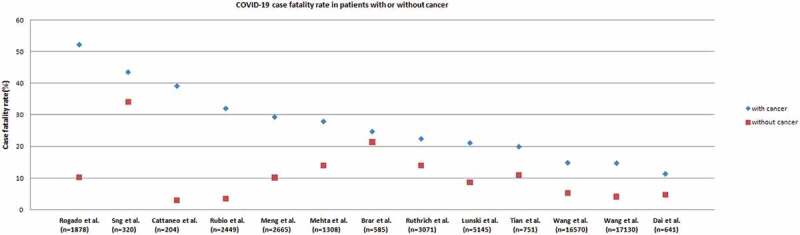
Scatter plot of COVID-19–related CFRs from series comparing rates from patients with cancer (blue dots) with patients without cancer (red dots)
Official websites use .gov
A
.gov website belongs to an official
government organization in the United States.
Secure .gov websites use HTTPS
A lock (
) or https:// means you've safely
connected to the .gov website. Share sensitive
information only on official, secure websites.
Scatter plot of COVID-19–related CFRs from series comparing rates from patients with cancer (blue dots) with patients without cancer (red dots)