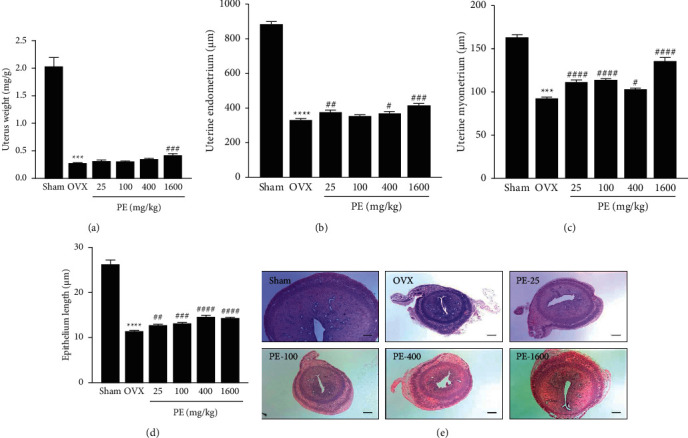
Figure 2.

Effects of PE on uterus weight and histological analysis in OVX rats. (a) Uterus weight, (b) uterine endometrial, (c) uterine myometrial, (d) uterine epithelial length, and (e) haematoxylin and eosin stain (50×, bar = 200 μm). Each column represents the mean ± standard error of mean (SEM). ∗∗∗p < 0.001 and ∗∗∗∗p < 0.0001vs. sham group; ##p < 0.01, ###p < 0.001, and ####p < 0.0001vs. OVX group.
