
Figure 10.
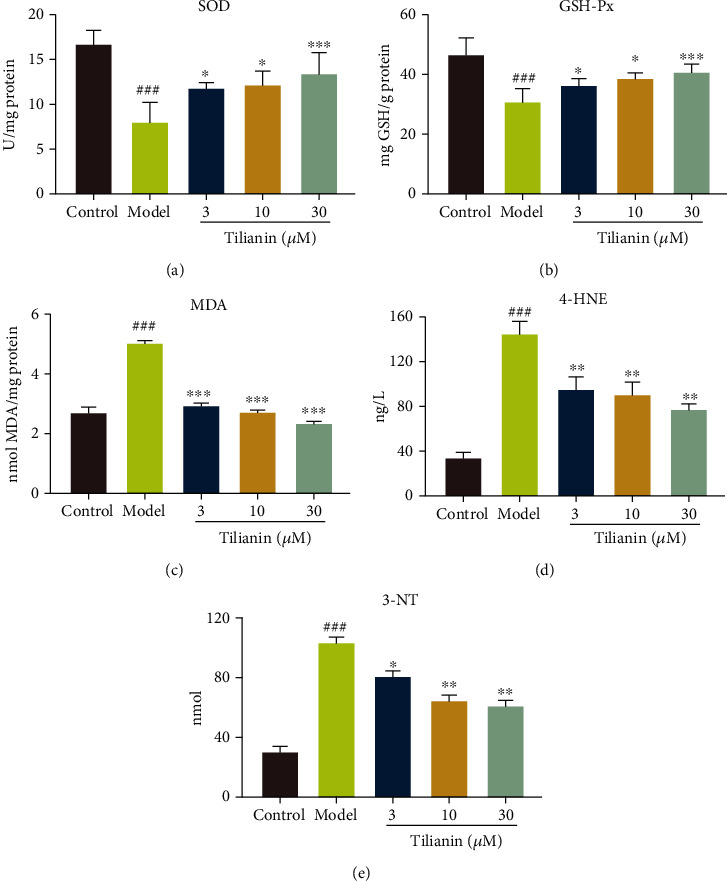
Tilianin inhibited oxidative stress on OGD-injured hNCs. (a–e) Activity of SOD (a), GSH-Px (b), MDA (c), 4-HNE (d), and 3-NT (e) in OGD-injured hNCs in the different groups (n = 4). Results represent means ± SD. ###P < 0.001 vs. control group; ∗P < 0.05, ∗∗P < 0.01, ∗∗∗P < 0.001 vs. OGD group.