
Figure 4.
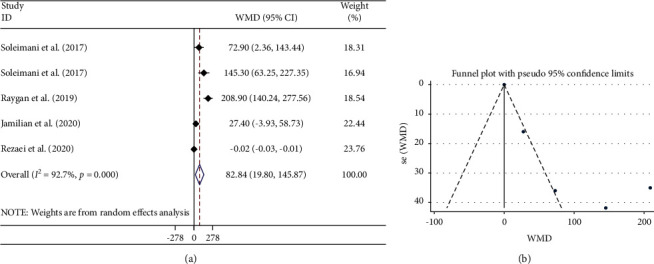
Forest plot (a) detailing weighted mean difference and 95% confidence intervals (CIs) and funnel plot (b) displaying publication bias in the studies reporting the effects of flaxseed oil supplementation on serum TAC concentrations. Horizontal lines represent 95% CIs. Diamonds represent pooled estimates from random-effects analysis. TAC: total antioxidant capacity; WMD: weighted mean difference; CI: confidence interval.