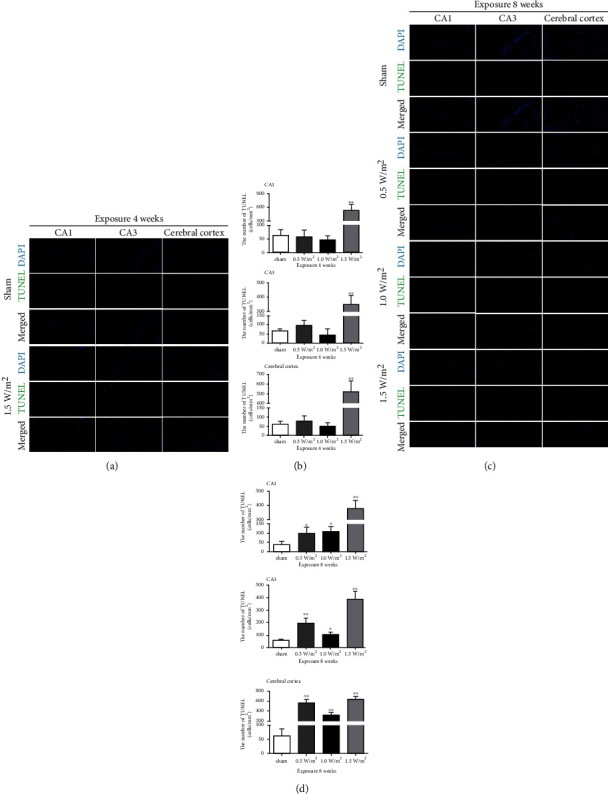
Figure 2.

TUNEL staining of the hippocampus (CA1 and CA3) and cerebral cortex (S1) of mice after L-HPM exposure for different durations. Original magnification: ×400. (a) Representative image of TUNEL staining of the hippocampus and cerebral cortex after 4 weeks of L-HPM exposure (scale bar = 50 μm). (b) Quantification of TUNEL-positive cells/mm2 in the hippocampus and cerebral cortex after 4 weeks of L-HPM exposure. (c) Representative image of TUNEL staining of the hippocampus and cerebral cortex after 8 weeks of L-HPM exposure (scale bar = 50 μm). (d) Quantification of TUNEL-positive cells/mm2 in the hippocampus and cerebral cortex after 8 weeks of L-HPM exposure. Student's t-test, mean ± SEM, ∗P < 0.05, ∗∗P < 0.01 compared with the sham group. TUNEL: deoxynucleotidyl transferase-mediated dUTP nick-end labeling; L-HPM: L-band high-power microwave.
