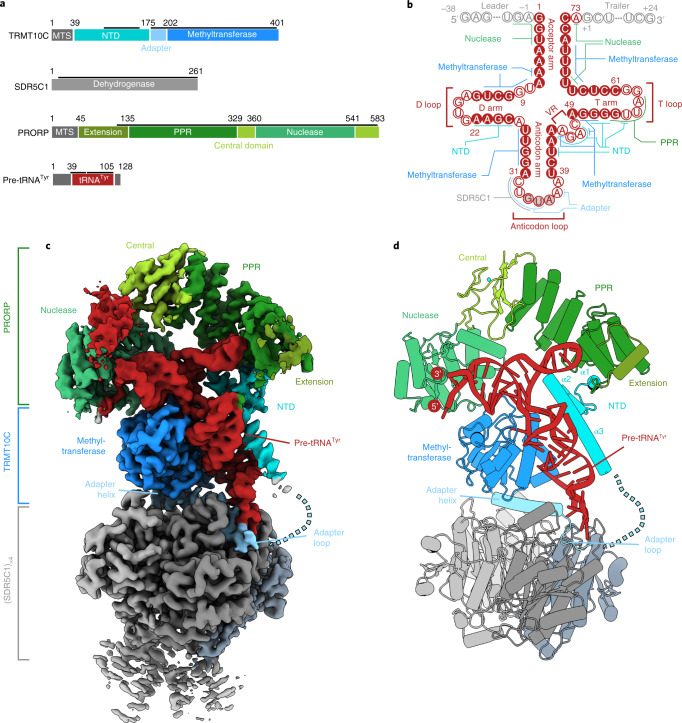
Fig. 1. Structure of the human mitochondrial RNase P complex.
a, Domain representation of mtRNase P subunits and substrate pre-tRNATyr. TRMT10C domains are shown in shades of blue; the four SDR5C1 subunits are shown in shades of gray; PRORP domains are shown in shades of green and the pre-tRNA is shown in red. Protein and RNA regions modeled in the structure are indicated with black lines. This coloring is used throughout. b, Schematic representation of the pre-tRNATyr with structural elements of the tRNA and RNA-protein interactions in the mtRNase P complex indicated. The tRNATyr sequence is shown in red and the leader and trailer sequences are shown in gray. The variable region is labeled as ‘VR’. Base-paired nucleotides are shown as solid circles and positioned in parallel. Unpaired nucleotides are shown as hollow circles. The three anticodon nucleotides are labeled and shown as gray circles with red outline. The numbering is according to canonical tRNA numbering33 and is used throughout (see Supplementary Note 1 for cross-referencing of canonical nucleotide positions in tRNATyr to the numbering in the deposited coordinates file). Leader sequences at the 5′ end of tRNA are labeled −38 to −1, and trailer sequences at the 3′ end are labeled +1 to +24. c, Cryo-EM density map of the mtRNase P complex. Coloring as in a. d, Cartoon representation of the structure of the mtRNase P complex. Helices α1–3 of the previously unmodeled TRMT10C NTD are labeled.

