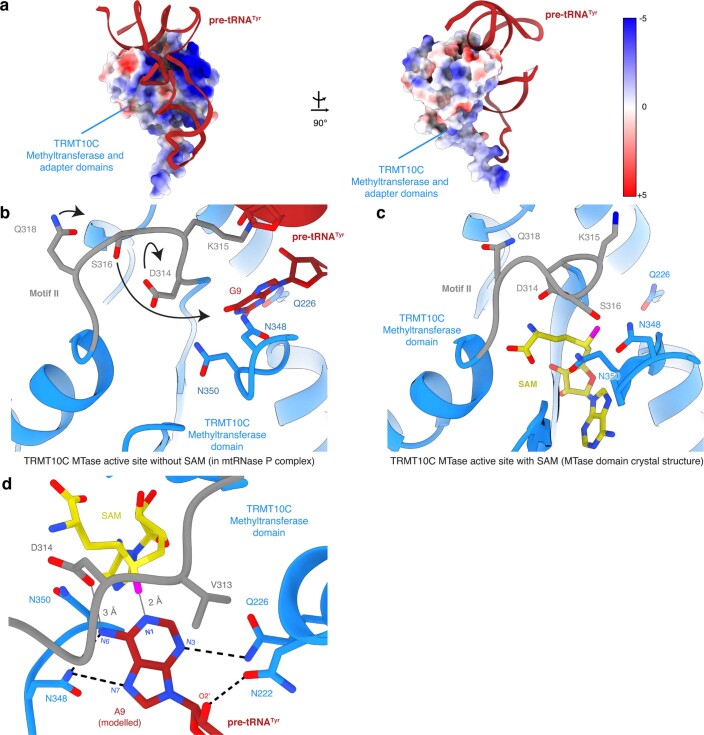
Extended Data Fig. 5. Comparison between apo and active TRMT10C methyltransferase domains.
a, Electrostatic surface potential for TRMT10C methyltransferase and adapter domains. Electrostatic surface coloring as in Fig. 5(c). The tRNA backbone, shown in red, interacts with positively charged regions on the TRMT10C surface. b, Close-up view of the methyltransferase active site of TRMT10C without SAM in the mtRNase P complex. Depiction as in Fig. 4(b). Motif II of TRMT10C (residues 314–319, shown in gray) adopts an open conformation. Arrows approximate the rearrangement of motif II residues upon SAM binding. c, Close-up of the methyltransferase active site of TRMT10C in the SAM-bound crystal structure (PDB: 5NFJ)19. Motif II of TRMT10C adopts a closed conformation. d, Pre-catalytic model of TRMT10C methyltransferase active site for A9 methylation. Adenine was modeled in the active site by changing the atomic coordinates of guanine to adenine while preserving the base conformation. TRMT10C and SAM are represented as in Fig. 4(c). Hydrogen bonds are shown as dashed black lines. Distances between A9–N1 and the SAM–methyl group, and between A9–N6 and the D314–sidechain carbonyl are labeled and shown as solid graey lines.

