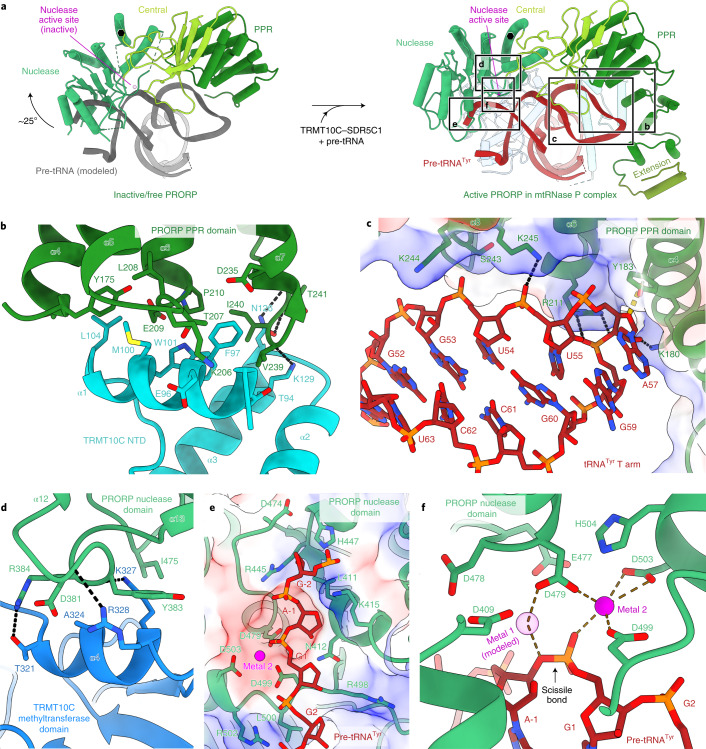
Fig. 5. Structure and substrate interactions of active human PRORP.
a, Comparison of free/inactive human PRORP (left) (PDB 4XGL)23 and activated human PRORP in mtRNase P complex (right), aligned via their PPR domains (residues 207–329). Active sites are marked as magenta spheres. In the active conformation, the nuclease domain is rotated outward by approximately 25° to accommodate the pre-tRNATyr. The axis of rotation is indicated by a black hexagon. Regions shown in panels b–f are indicated. b, Interactions between the NTD of TRMT10C and the PPR domain of PRORP. Residues in the NTD and PPR domain within 4 Å of the interaction interface are shown as sticks. c, Interaction of the pre-tRNATyr T arm with the PPR domain of PRORP. PRORP residues within 4 Å of tRNA are shown as sticks. The surface electrostatic potential of the PPR domain is shown transparently as a three-color gradient scheme from −5 to +5 kcal mol−1 e−1 (red, negative; white, neutral; blue, positive). d, Interactions between the methyltransferase domain of TRMT10C and the nuclease domain of PRORP. Residues in the methyltransferase domain and nuclease domain within 4 Å of the interaction interface are shown as sticks. e, Interactions between the pre-tRNATyr backbone and the nuclease domain. RNA backbone and PRORP residues within 4 Å are shown as sticks. The surface electrostatic potential of the nuclease domain is shown as in c and the active site metal 2 is shown as a solid magenta sphere. f, Substrate-bound PRORP active site. Residues in the active site and the pre-tRNATyr are shown in stick representation. Metal 2 is shown as a solid magenta sphere. Metal 1 was modeled on the basis of the At-PRORP1 crystal structure (PDB 4G24)41, and is shown as a transparent magenta sphere. Potential coordination interactions with metal 1 and 2 are shown as brown dashed lines.

