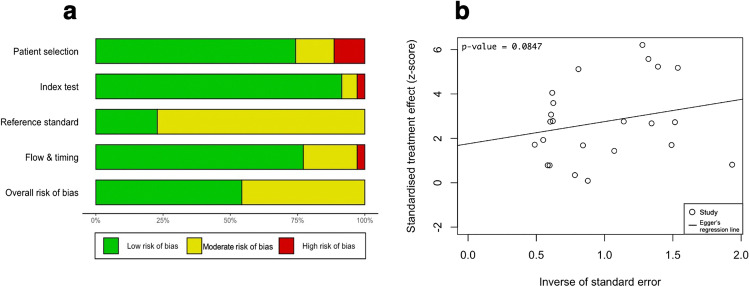
Fig. 2.
In Fig. 2a, risk of bias summary plot with bar chart of the distribution of risk-of-bias judgments for all included studies (n = 35) across the domains of the QUADAS-2 tool [69], shown in percentages (%), is shown. In the bottom, an overall risk of bias, which represents the collated risk-of-bias judgments for all domains, is depicted. The reference standard refers to shunt responsiveness. In Fig. 2b, an Egger’s asymmetry test funnel plot [9] of all data points included in the meta-analysis (n = 24; two studies used twice due to discussing two index tests) indicating presence and degree of publication bias is shown. P-value < 0.05 is deemed significant and implicates publication bias. Egger’s asymmetry test yielded 0.0847%, calculated running an Egger’s regression [9] (see Egger’s regression line) on the collated logDOR and standard errors of all data used in the meta-analysis (n = 24)

