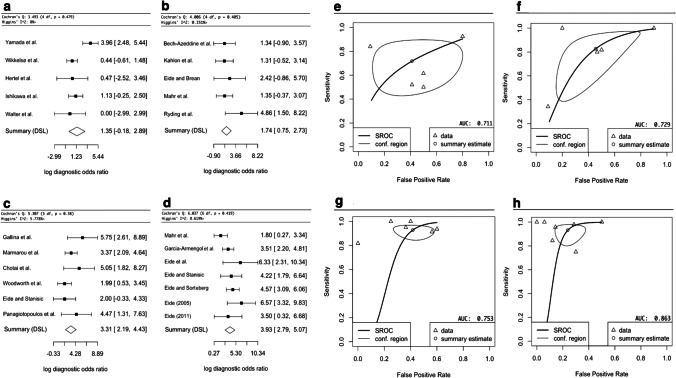
Fig. 3.
Forest plots indicating the log diagnostic odds ratio (logDOR) of TT (tap test) in Fig. 3a, IT (infusion test) in Fig. 3b, ELD (extended lumbar drainage) in Fig. 3c, and ICPM (intracranial pressure monitoring) in Fig. 3d, as well 95% confidence intervals in brackets. At the bottom of each graph, the DerSimonian-Laird (DSL) summary point is shown, which is the summary diagnostic odd ratio (DOR), drawn as a diamond with width inversely proportional to its standard error. A higher DOR implies higher diagnostic effectiveness. Cochrane Q test [9] is shown with p < 0.05% indicating significance, and Higgin’s I2 test [68] with < 25%, 25–50%, > 50% indicating low, moderate, and high heterogeneity, respectively. Study-specific estimates of sensitivity and false-positive rate values are shown in summary receiver operating characteristics (SROC) curve for TT in Fig. 3e, IT in Fig. 3f, ELD in Fig. 3 g, and ICPM in Fig. 3 h. The SROC curve is drawn in black, and the confidence region (95%) is drawn in grey. The data points are symbolized by triangles, and the summary estimate as a circle. The area under the curve (AUC) is shown in the bottom right corner with an AUC of 1 indicating highest diagnostic effectiveness and an AUC of 0.5 or below indicating an ineffective test

