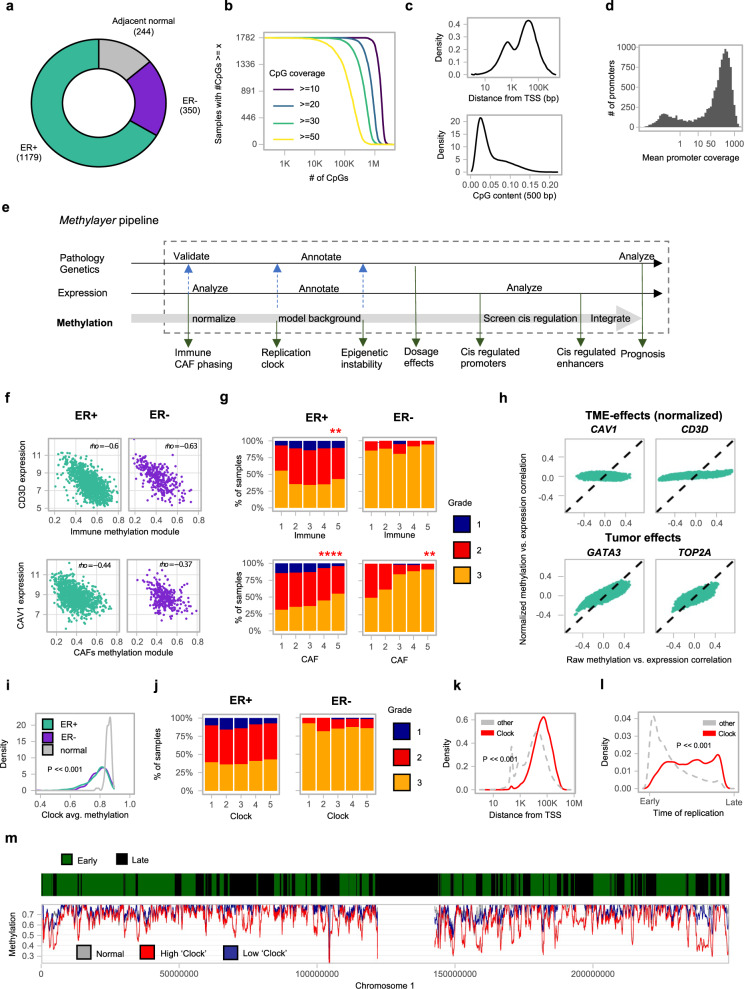
Fig. 1. Dissecting tumor, immune, and CAF methylation in the METABRIC cohort.
a Distribution of METABRIC samples used for RRBS profiling. b Number of samples (Y axis) with a given number of CpGs (X axis) covered with at least 10, 20, 30, or 50 reads. For example, in all samples 449,710 CpGs are covered with over 10 reads. c Distribution of TSS distance (top) and CpG content (bottom) for CpGs covered by at least 5 reads in half or more samples. d Distribution of mean promoter coverage over all METABRIC samples, considering 13,198 active promoters (“Methods”). e The Methylayer analysis pipeline. Integration of data is marked by black arrows. Annotation of the model is marked by blue dashed arrows. f Correlation of average expression of CD3D/CAV1 and the immune/CAF methylation module. g Distribution of tumor grade stratified by five bins of Immune/CAF methylation scores (χ2 test: p = 0.0056 for Immune score in ER+, p = 0.3052 for Immune score in ER−, p = 0.00001 for CAF score in ER+, p = 0.0031 for CAF score in ER−). *p ≤ 0.05, **p ≤ 0.01, ***p ≤ 0.001, ****p ≤ 0.0001. h Distribution of correlations of four key gene expression profiles with raw-methylation levels of individual gene promoters (X axis), versus the correlation derived after normalizing methylation for CAF/immune composition using a K-nn strategy (as described in “Methods”). Flattening of the post normalization correlations demonstrate the effect of the CAF/immune normalization, while maintenance of the post normalization correlations demonstrates that the genes that are not affected by normalization. i Distribution of average (non-normalized) methylation over loss-clock loci (correlation over 0.6 with the score) for normal breast, ER+ and ER− breast cancer samples (two-tailed Kolmogorov–Smirnoff test, p < 2.2e−16). j Distribution of tumor grade stratified by five bins of loss-clock score. k Distribution of TSS distance for loss-clock loci versus other loci (two-tailed Kolmogorov–Smirnoff test, p < 2.2e−16). l Distribution of time-of-replication for loss-clock loci (red) versus overall distribution of non-promoter loci (gray) (two-tailed Kolmogorov–Smirnoff test, p < 2.2e−16). m Replication time classifications for chromosome 1 (top color-coded bar). The average methylation in non-promoter loci, computed for normal breast tissues (gray), and two ER+ breast cancer groups with high (red) and low (blue) clock scores, respectively, is shown below.

