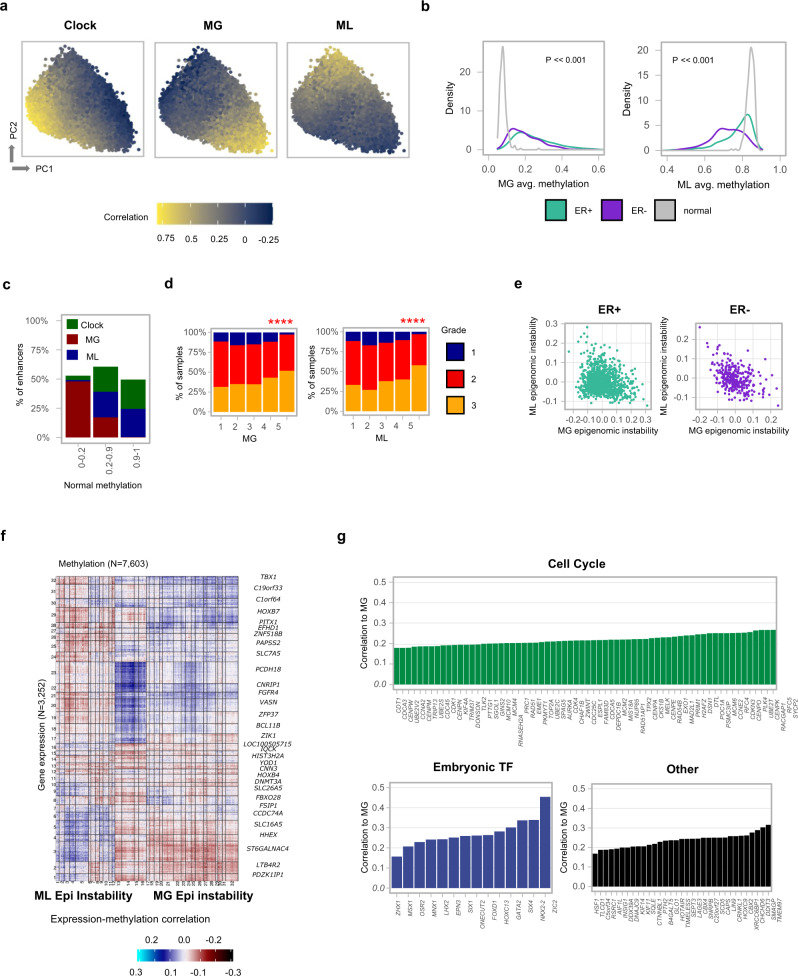
Fig. 2. Epigenomic instability in breast cancers.
a Color-coded maps represent 201,082 genomic loci projected over the two first principal components given their correlations with the three Methylayer scores. b Distribution of average (non-normalized) methylation over MG and ML loci (correlation over 0.5 with each score) for normal breast, ER+ and ER− breast cancer samples (two-tailed Kolmogorov–Smirnoff test: MG loci, p < 2.2e−16; ML loci, p < 2.2e−16). c Fraction of enhancers (grouped by their normal methylation level) that are linked (correlation > 0.25) with each of the three Methylayer scores. d Distribution of ER+ tumor grade stratified by five bins of MG/ML methylation scores. ****p < 0.0001 (χ2 test: MG loci, p = 0.000002; ML loci, p < 5.4e−10). e Comparing ML and MG scores over ER+ and ER− samples. f Clustered correlation heat map between normalized methylation profiles (columns, including all loci with correlation >0.3 for MG or ML) and matching gene expression (rows) in ER+ tumors. Clusters are labeled by their top correlated gene. Complete information is available in Supplementary Data 4. g Groups of genes showing positive expression correlation with the MG score (see Supplementary Data 6. Complete information for ML score is also available in this table).

