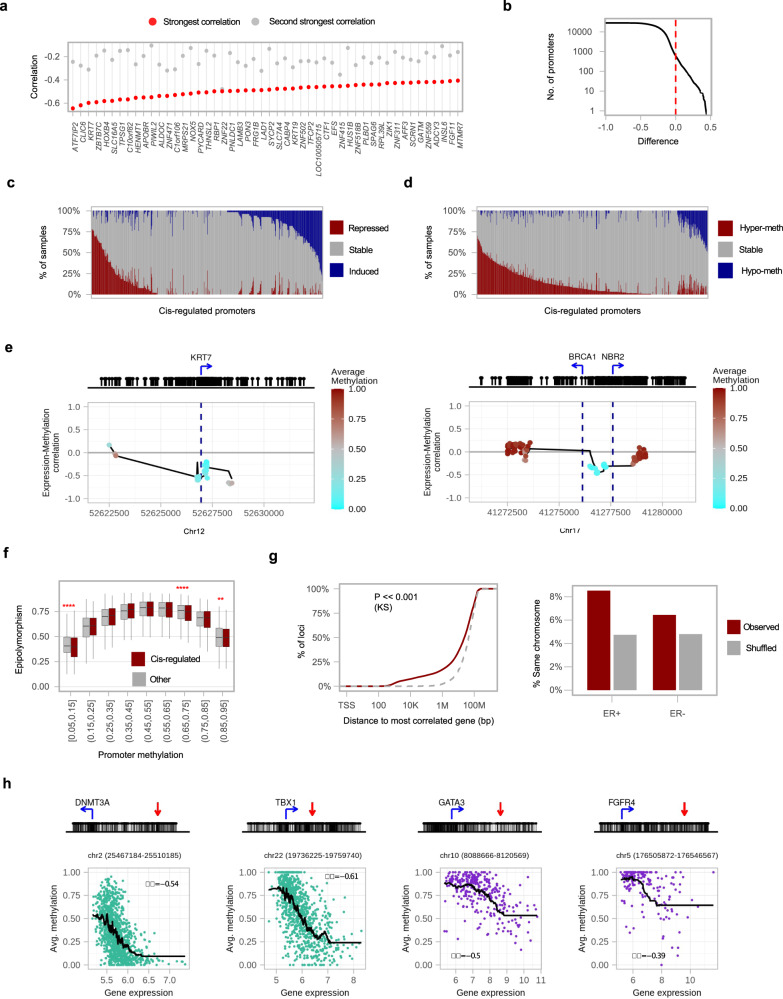
Fig. 3. Expression–methylation correlation in cis.
a Plot of the 50 genes with strongest negative correlation (red) of expression with their own promoter methylation profile (in cis E–M correlation) in ER+ tumors, compared to the correlation with the second strongest promotor locus in the genome (out of 9360 candidates, gray). b Distribution of the difference between in cis E–M correlation, and the top correlation of the same gene with any other promoter. Positive values represent cases where the in cis E–M correlation is the maximum. c For 612 genes with support for in cis E–M correlation, we show the distribution of differential tumor expression relative to matched normal tissues. Repressed/induced: over twofold change. d For 612 promoters with support for in cis E–M correlation, we show the distribution of differential methylation compared to matched normal tissues. Hyper-/hypo-methylated: over 0.2 different in average methylation. e Correlation of CpG methylation with gene expression in KRT7 locus (in ER+ tumors) and BRCA1 (in ER− tumors). f Distribution of Epi-polymorphism for promoters defined with high in cis E–M correlation. Shown are promoters that had at least one tumor sample with average methylation above 0.05 (red, n = 306). Loci are grouped by average promoter methylation and other promoter loci (gray, n = 3570) are provided for control. *p ≤ 0.05, **p ≤ 0.01, ***p ≤ 0.001, ****p ≤ 0.0001 (one-sided Wilcox test). The middle line indicates the median, box limits represent quartiles, and whiskers are 1.5× the interquartile range. g Left: Cumulative distribution of the distance between methylation loci and the promoter with highest expression correlation to them (within the same chromosome, two-tailed Kolmogorov–Smirnoff test, p < 2.2e−16). Right: fraction of loci for which the best-correlated promoter is located on the same chromosome. Gray line/bars represent shuffled controls (see “Methods”). h Examples for matching expression and methylation for non-promoter genomic loci located in the proximity of their most correlated gene (DNMT3A and TBX1 in ER+ tumors; GATA3 and FGFR4 in ER− tumors). Above: Location of the non-promoter genomic loci (red arrow) relative to the TSS of the gene (blue arrow). Below: Correlation of the matching expression of the most correlated gene (X axis) and methylation (Y axis) for the non-promoter genomic loci.

