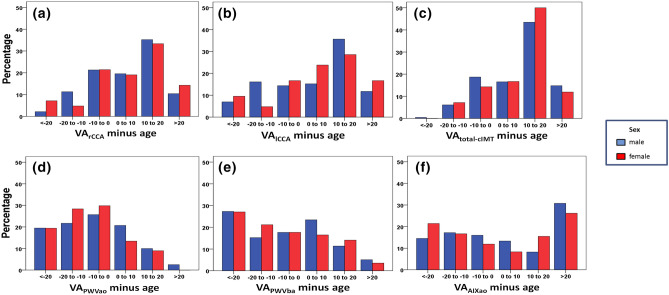
Figure 1.
Percentage distribution of VArCCA minus age (a)), VAlCCA minus age (b)), VAtotal-cIMT minus age (c)), VAPWVao minus age (d)), VAPWVba minus age (e)) and VAAIXao minus age (f)). Visualisation of accelerated vascular aging (i.e., vascular age exceeding chronological age) by the distribution of the difference of vascular and chronological age. A negative value represents vascular pre-aging. Since analyses were performed with “81 years” being the maximum VA of the cIMT examination, only patients aged < 61 years could possibly enter the group of individuals exhibiting pre-aging of > 20 years. In general, vascular age derived from PWA (first row) was similar or even smaller than patients´ age while VA derived from cIMT (second row) delivered opposite results. VA vascular age, PWVao aortic pulse wave velocity, PWVba branchial-ankle pulse wave velocity, AIao aortic augmentation index, rCCA right common carotid artery, lCCA left common carotid artery, total-cIMT total carotid intima-media thickness.

