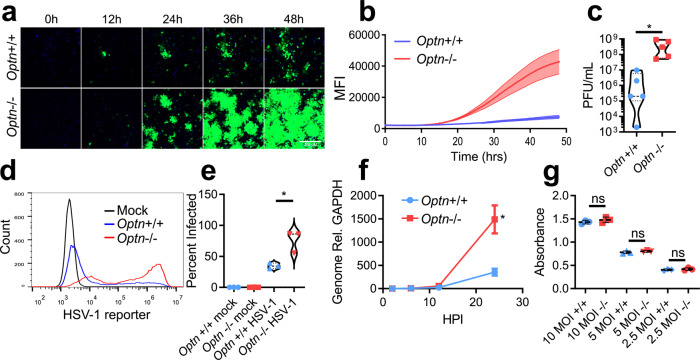
Fig. 1. OPTN restricts spread of HSV-1.
a Representative time-lapse imaging of Optn+/+ and −/− cells infected with GFP-HSV-1 17-strain at 0.1 MOI for 48 h. Time interval was 30 min. Scale bar is 250 µm. b Quantification of average time-lapse fluorescent intensity over time for three replicates. c Violin plot of Optn+/+ and −/− cells infected with HSV-1 at 0.1 MOI and assayed for plaques 24 hpi. n = 5 independent replicates per group. P = 0.0446. d, e (left) Histogram of Optn+/+ and −/− cells infected with GFP- HSV-1 at 0.1 MOI 24 hpi measured by flow cytometry, (right) violin plot of percentage of cells infected with GFP-HSV-1. n = 3 independent replicates per group. P = 0.0174. f Genomes present in Optn+/+ and −/− cells infected with GFP- HSV-1 at 0.1 MOI. n = 3 independent replicates per group. P = 0.0220. g Colorimetric readout of replication deficient and β-galactosidase expressing HSV-1 infected Optn+/+ and −/− cells at multiple MOIs. n = 3 independent replicates per group. P = 0.3083 (10 MOI), P = 0.3575 (5 MOI), P = 0.4945 (2.5 MOI). Data are presented as mean values ± SEM (b, f). Two-tailed Student’s t test was performed for statistical analysis (α = 0.05). ∗p < 0.05; ns not significant. Source data are provided as a Source Data file.

