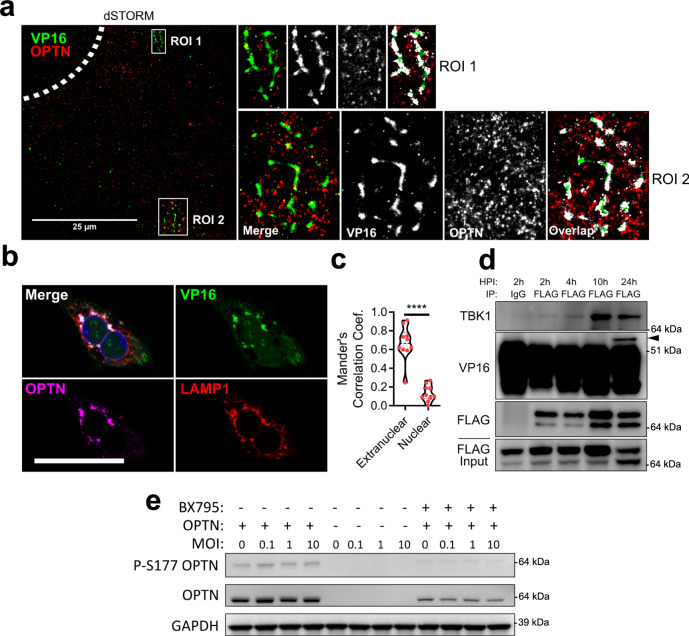
Fig. 4. OPTN is associated with VP16 during HSV-1 infection and is activated by TBK1.
a dSTORM super-resolution microscopy for OPTN and VP16 staining. Enlarged images highlight association of OPTN and VP16 stained structures. Shown to the right are the enlarged images for regions of interest (ROI) representing the merged images, the raw signal for VP16 and OPTN, and the pixel overlap between the channels. Scale bar is 25 µm. Dashed line represents nucleus. b Representative image of Optn+/+ cells infected with VP16-gfp HSV-1 at MOI 1 for 12 h stained for OPTN and LAMP1. Scale bar is 50 µm. c Mander’s colocalization coefficient representing the proportion of VP16 and OPTN co-staining. n = 10 cells analyzed for colocalization. P < 0.0001. d Immunoblot of anti-FLAG co-immunoprecipitation of Optn+/+ cells expressing FLAG-OPTN and infected with HSV-1 at 1 MOI. Arrow points to VP16 band. e Immunoblot of Optn+/+, Optn−/−, or Optn+/+ cells treated with TBK1 inhibitor, BX795 (50 µM), infected with HSV-1 for 3 h. Two-tailed Student’s t test was performed for statistical analysis (α = 0.05). ∗∗∗∗p < 0.0001. Source data are provided as a Source Data file.

