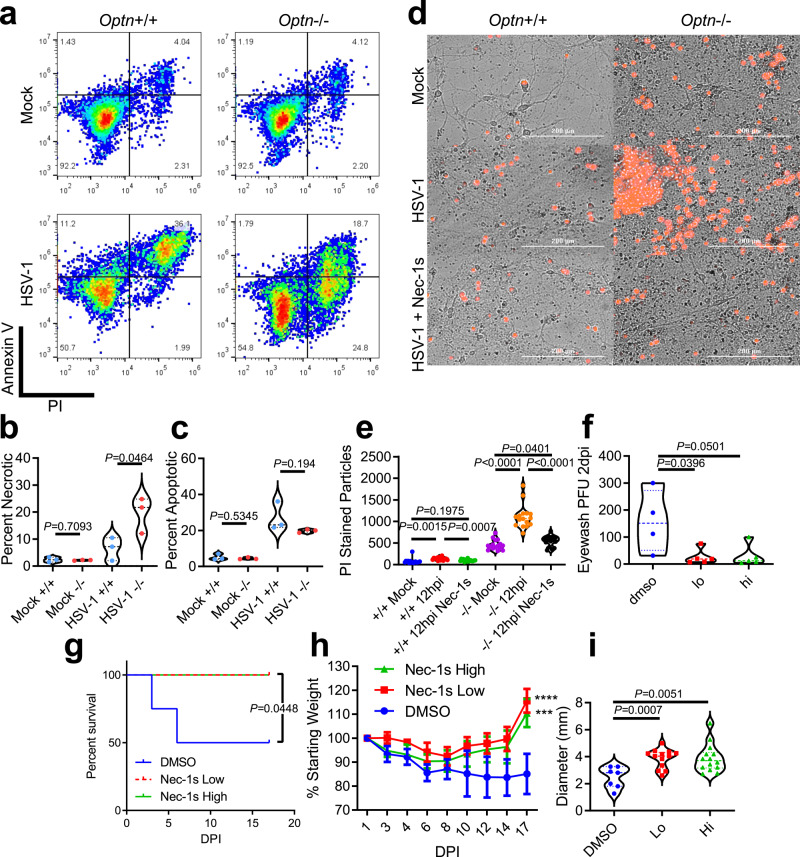
Fig. 7. OPTN suppresses necroptosis in vitro and in neurons during HSV-1 infection.
a Dot plots of flow cytometry analysis of Optn+/+ and −/− cells stained for Annexin V and propidium iodide (PI). b, c Percentage of (b) Annexin V lo, PI hi cells indicating necrotic cells or c Annexin V hi, PI hi cells indicating apoptotic cells. d Representative images of primary embryonic neurons from Optn+/+ or −/− mice that were mock infected, HSV-1 infected, or HSV-1 infected and Nec-1s treated. Dead cells were stained using PI (Red). e Image quantification of PI-stained primary neurons. f–i Optn−/− were treated with hi Nec-1s (n = 5 mice), lo Nec-1s (n = 5 mice), or DMSO (n = 4 mice) during infection. f Plaque assay on ocular washes from Optn−/− mice 2 dpi. g Kaplan–Meier curve for HSV-1 infected Optn−/− treated with DMSO, lo or hi Nec-1s. Logrank test for trend was used to compare curves with P < 0.05 being significant. h Percentage of initial weight over time. Two-way repeated-measures ANOVA F(16,88) = 1.758, p = 0.0503, multiple comparisons at 17 dpi (DMSO vs. Nec-1s Low) p < 0.0001, (DMSO vs. Nec-1s High) p = 0.0009. i dLN diameters for Optn−/− mice treated with DMSO, lo Nec-1s, or hi Nec-1s at 17dpi and data are presented as mean values ± SEM. Unless otherwise stated Two-tailed Student’s t test was performed for statistical analysis (α = 0.05). ∗p < 0.05; ∗∗p < 0.01; ∗∗∗p < 0.001, ∗∗∗∗p < 0.0001, ns not significant. Source data are provided as a Source Data file.

