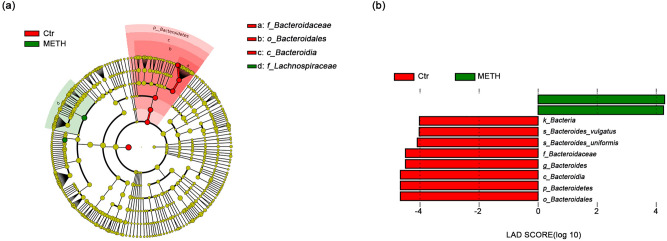
Figure 3.
Taxonomic representation of significant differences in relative abundances between the METH and Ctr groups. (a) Cladograms generated by LEfSe indicating differences in the bacterial taxa between the subjects with METH use disorder (METH) and the control (Ctr) subjects. Nodes in red indicate taxa that were enriched in the Ctr compared to the METH group, while nodes in green indicate taxa that were enriched in the Ctr compared to the METH group. (b) LDA scores for the bacterial taxa with differential abundances between the METH and Ctr groups. Positive and negative LDA scores indicate bacterial taxa enriched in the METH and Ctr groups, respectively. Only the taxa with p < 0.01 (Wilcoxon rank-sum test) and LDA > 4.0 are shown in the figure legend.

