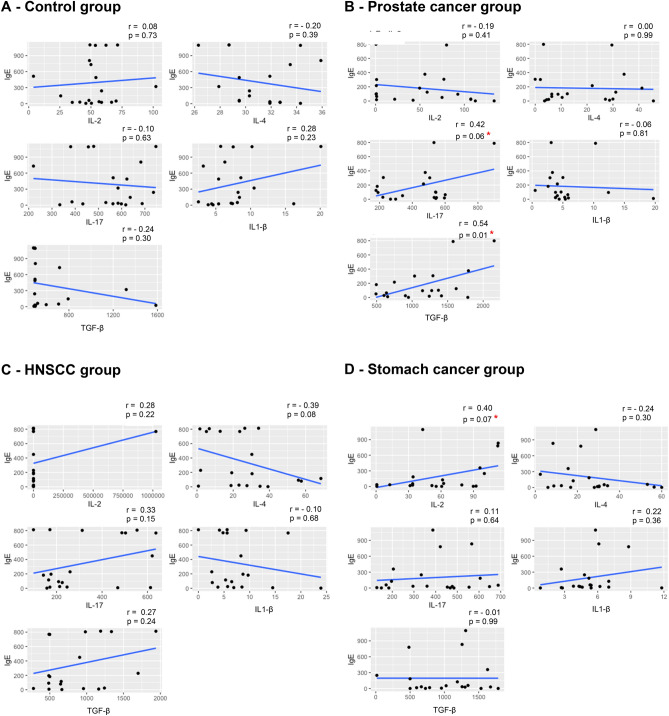
Figure 1.
Dispersion diagrams and linear regression axes based on the correlation factors between cytokines (pg/ml) and IgE (UI/ml), stratified by patient group. Spearman Correlation Test. * Groups with a moderate correlation (Devore JL 45). Groups: Control (n = 20), Prostate cancer (n = 20), HNSCC (n = 20), Stomach cancer (n = 20). Abbreviations: IgE = immunoglobulin E, IL = interleukin, TGF = transforming growth factor, HNSCC = head and neck squamous cell carcinoma.

