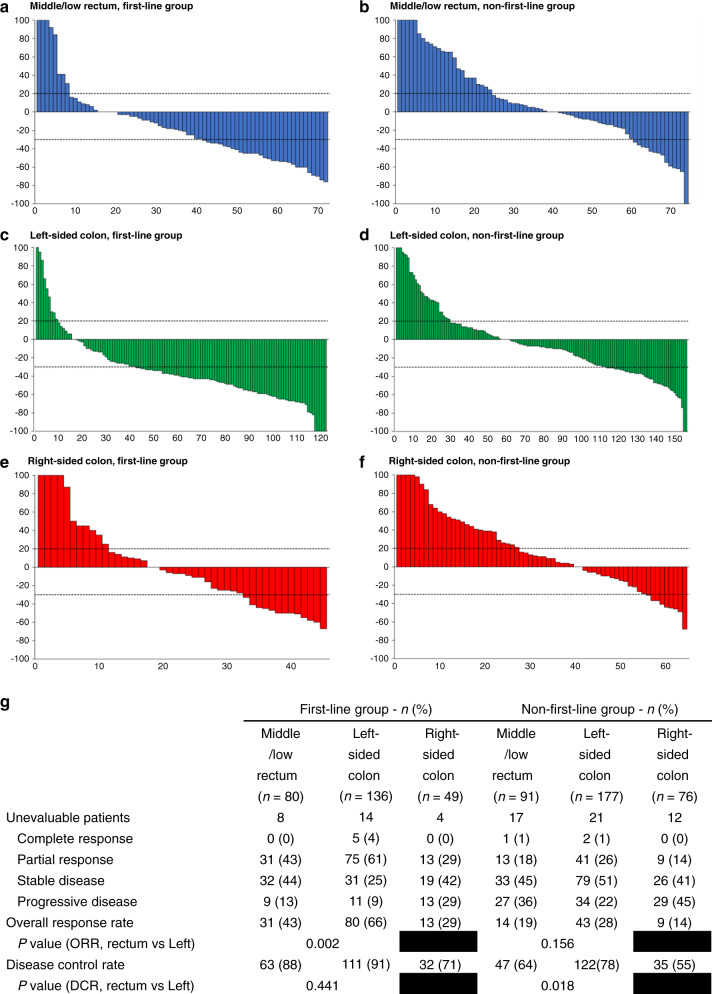
Fig. 2. Best percentage change in the size of metastasis and best response in patients.
a–f show the waterfall plots of the best percentage change in the size of target lesions in each patient from the six groups. The analysis is based on Response Evaluation Criteria in Solid Tumours, version 1.1 (RECIST 1.1). The dashed lines at 20% and −30% represent progressive disease and partial response. The line at 0% means either no changes in metastatic sites or the development of a new lesion. g shows the tumour response in patients in different groups and is also evaluated based on RECIST 1.1. n number, ORR overall response rate, DCR disease control rate.

