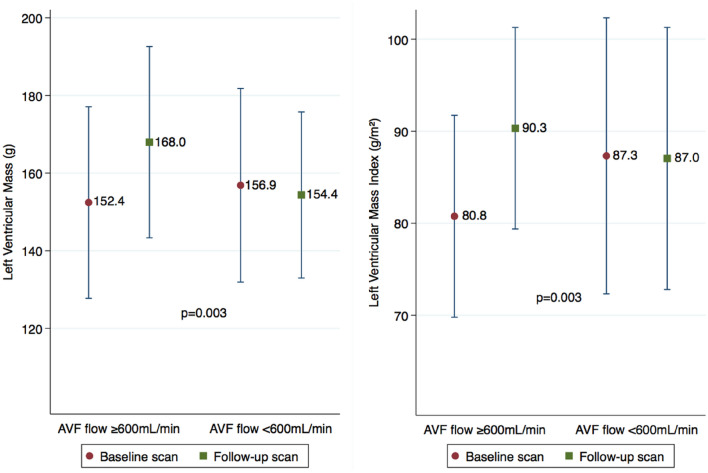
Figure 2.
Difference in the means of left ventricular (LV) mass (left) and LV mass index (right) between the 2 scans according to the brachial artery blood flow (p = 0.003 for the difference between groups). This figure shows the means in 40 subjects who completed the second cardiac magnetic resonance scan, 22 with blood flows ≥ 600 mL/min and 18 with blood flows < 600 mL/min. Change in means and the 95% CI show a significant statistical difference between groups (p = 0.003) with an independent t-test.

