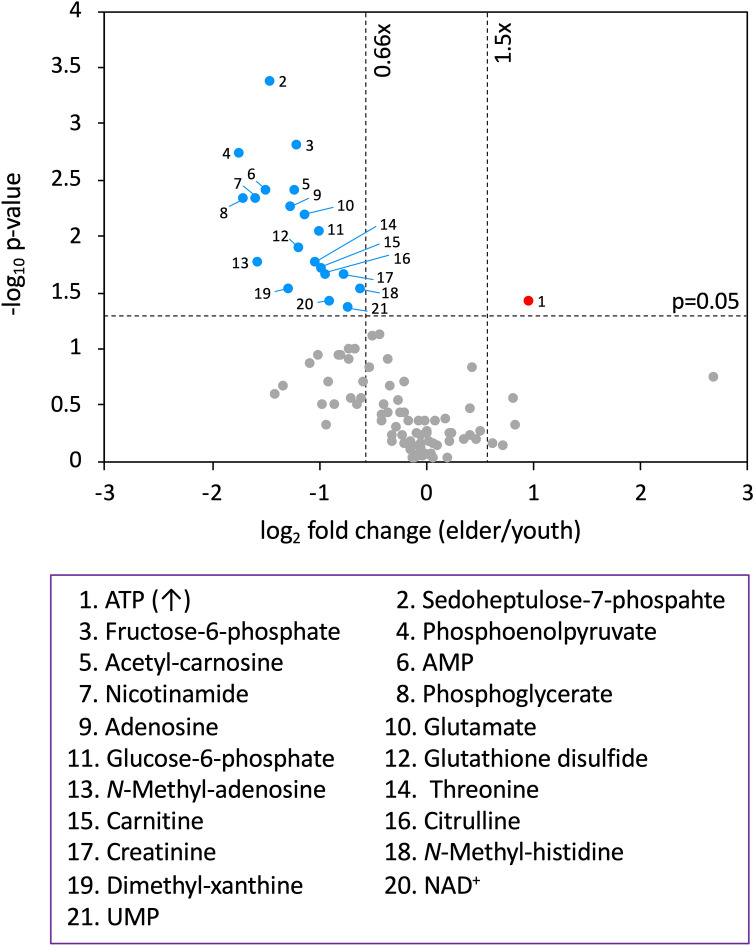
Figure 1.
Volcano plot showing different levels of salivary metabolites in young and elderly subjects. The x-axis is the log2 fold change, whereas the y-axis is the -log10 p value of the Mann Whitney U-test. Two vertical dashed lines show the border of 0.66- and 1.5-fold change, respectively. The horizontal dashed line shows a p value = 0.05. Plots represent significantly higher (red), lower (blue), and unchanged metabolites (gray) in the elderly group. Twenty-one metabolites manifesting age differences are listed in the purple box.

