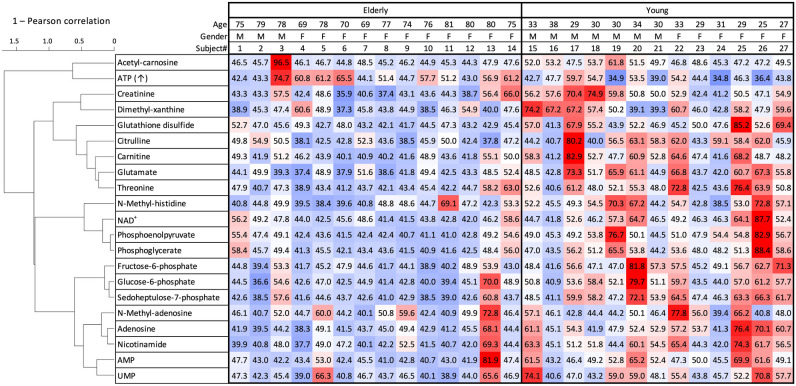
Figure 4.
Hierarchical clustering heatmap of 21 salivary age-related metabolites in 14 elderly and 13 young subjects. Correlations between compounds are reflected by bar lengths, which is consistent with the correlation network data (Supplementary Fig. S3). Standardized scores (T scores) for each metabolite are represented by colors. The average value (50), white; values above average, red; values below average, blue. Color intensity of the cells reflects the T score. The cluster dendrogram was created by using R. Microsoft Excel was used to calculate T scores and create the heatmap.

