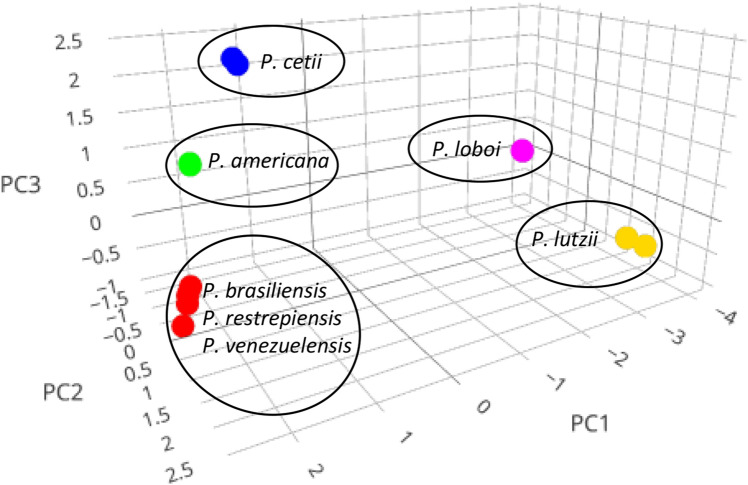
Figure 2.
Graphical output of the Gp43 DNA sequences PCA cluster analysis (total variation 90.3%, or 83.6% for PC1 (71.0%) and PC2 (12.6%)). The scatterplot shows the PC1, PC2 and PC3 results grouping Paracoccidioides species in five independent clusters including P. americana (green), P. cetii (blue), P. loboi (pink), and P. lutzii (yellow). Paracoccidioides brasiliensis (sensu stricto), P. restrepiensis, and P. venezuelensis appeared together in one of the clusters (red).

