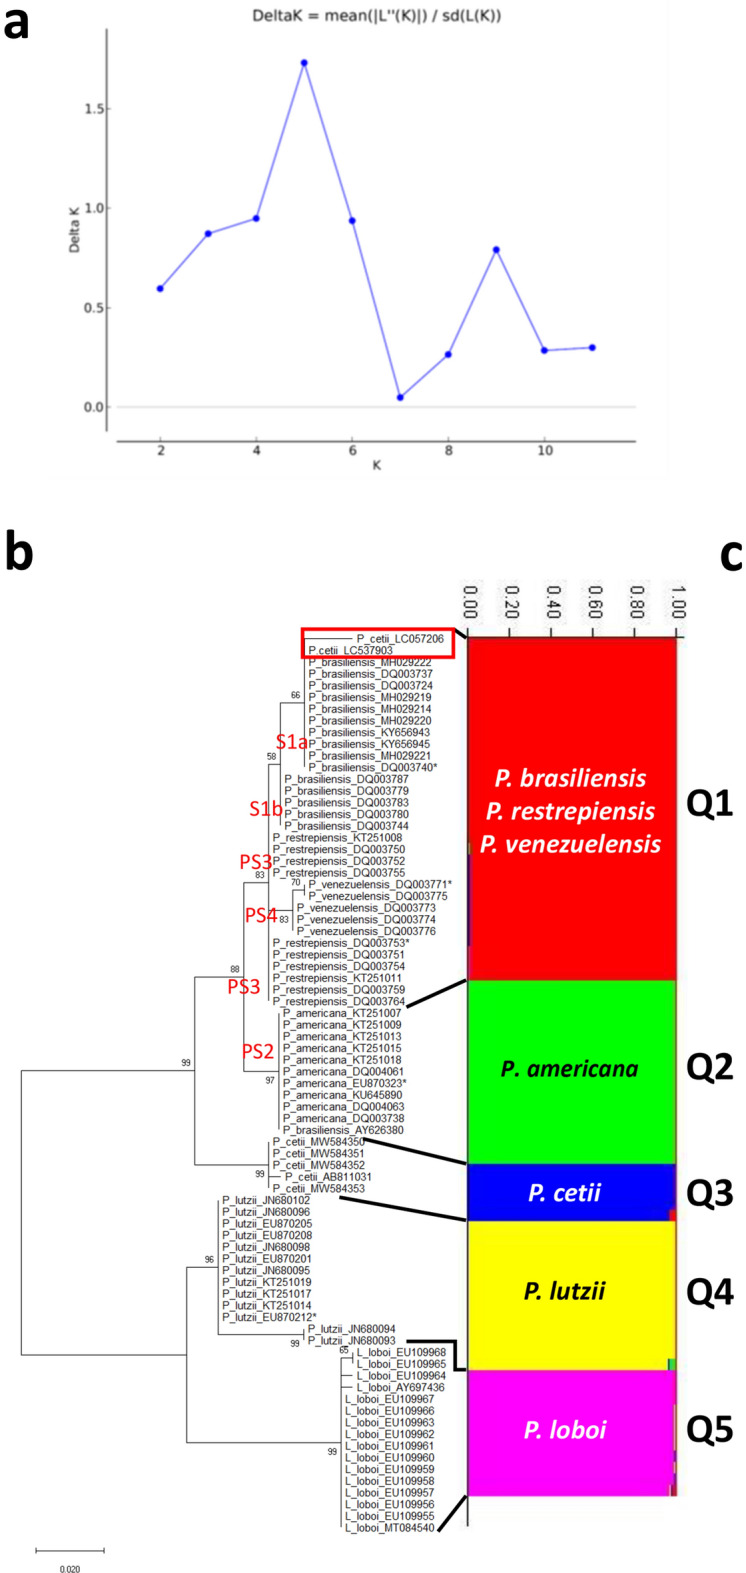
Figure 4.

Estimation of population using LnP(D) derived ΔK for K, from 1 to 10 (K = 5), using Gp43 DNA sequences (Panel a). Evolutionary analyses inferred by Maximum Likelihood of the Gp43 DNA sequences displays five monophyletic clusters (b) corresponding also to five STRUCTURE populations (Q1 to Q5) (c). STRUCTURE clustered P. brasiliensis (1Sa, 1Sb), P. restrepiensis (PS3), P. venezuelensis (PS4), in population Q1 (red), whereas the remaining species (P. americana [PS2, green], P. cetii [blue], P. lutzii [yellow] and P. loboi [pink]) grouped as independent populations (Q2 to Q5). The numbers on the y-axis show the subgroup membership and the x-axis the different accessions (Q) (Panel c). The distribution of accessions into different populations is indicate by color and shape.
