Figure 6.
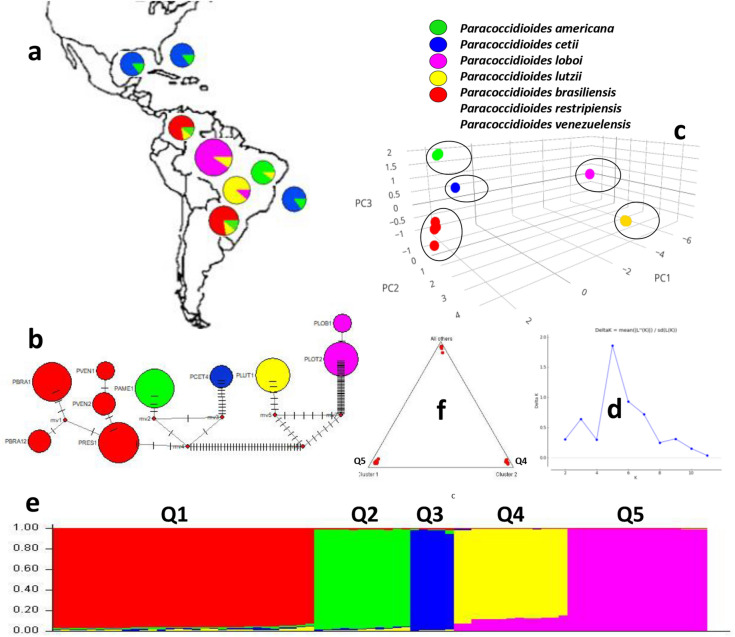
The concatenate Gp43 and ADP-rf data analyses was used to perform haplotypes analysis, to locate their geographical distributions (a,b), to estimate Principal Component Analysis (PCA) (c) and to investigate STRUCTURE population distribution (d–f) of several Paracoccidoides species including P. cetii from dolphins and P. loboi from humans. The geographical distribution of the five haplotypes (b) is shown in Panel (a). Five clusters are observed in haplotype analysis (b) each corresponding to P. loboi (PLOT-pink), P. lutzii (PLUT yellow), P. cetii (PCET-blue), P. americana (PAME-green). The other Paracoccidoides species formed single haplotypes (red). Small bars between haplotypes represent mutations and the median vectors (red dots) are missing or extinct haplotypes. The size of the spheres is proportional to the number of individuals in each circle. Five-populations were also found using PCA (c) and STRUCTURE (d–f) analyses. Panel d shows K = 5 value used to build the concatenated data. STRUCTURE analysis (e) showed P. americana (Q2-green), P. cetii (Q3-blue), P. loboi (Pink-Q5) P. lutzii (yellow-Q4), and the remaining Paracoccidioides species (Q1-red) clustering in independent barplots (e). The numbers on the y-axis show the subgroup membership and the x-axis the different accessions (Q). The distribution of accessions into different populations is indicate by color and shape. The triangle plot (f) is an analogous result obtained from STRUCTURE software outputs. The two cluster on the base of triangle corresponds to P. loboi (Q5) and P. lutzii (Q4) DNA sequences; the top harbor the remaining species in this study.

