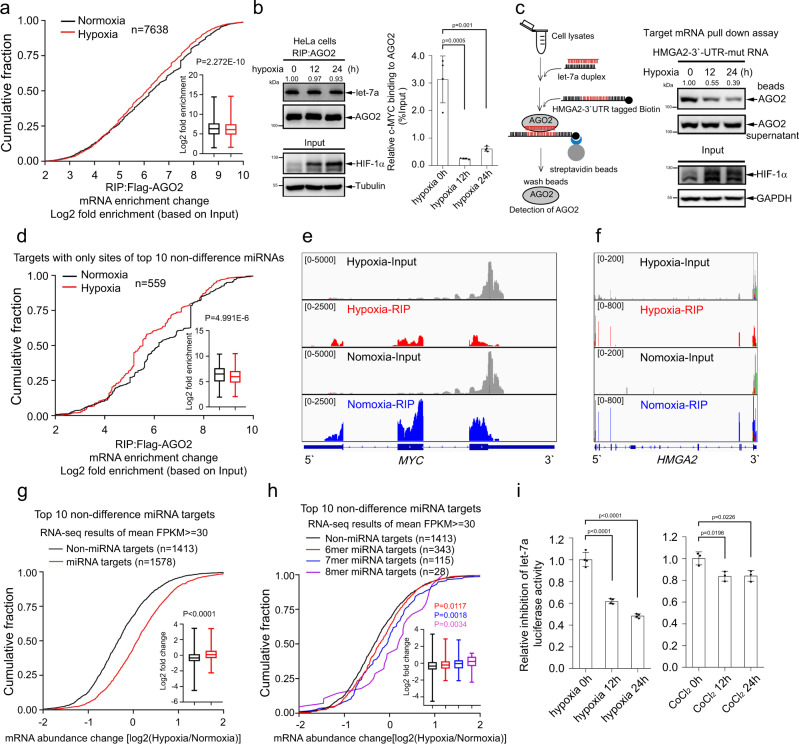
Fig. 1. Hypoxia impairs miRNA-targeted mRNA loading to AGO2 and inhibits mRNA decay.
a Hypoxia inhibited mRNA loading to AGO2. Cumulative fraction analysis of RIP-Seq for mRNA transcripts bound to AGO2 (n = 7638 mRNA transcripts) in stable HeLa cells expressing Flag-AGO2 under hypoxia (1% O2) for 24 h. b, c Hypoxia suppressed the interaction of let-7a-targeted c-MYC and HMGA2-3′-UTR-mut with AGO2. b HeLa cells treated with hypoxia were performed by RIP assay, let-7a and c-MYC associated with AGO2 were detected by northern blotting and qRT-PCR, respectively. Data were mean ± s.d., n = 4 biologically independent samples, and P-values were determined by unpaired two-sided t-test. c Cell lysates from 293 T cells treated with hypoxia were co-incubated with let-7a duplex mimics and biotin-tagged HMGA2-3′-UTR-mut for in vitro targeted mRNA pull-down assay. AGO2 associated with HMGA2-3′-UTR-mut was pulled down by streptavidin beads, and then detected by WB. d–f Hypoxia decreased the interaction of AGO2 with mRNAs targeted by only top 10 non-difference miRNAs. Cumulative fraction analysis of AGO2 bound mRNA transcripts (n = 559 mRNA transcripts) targeted by only top 10 non-difference miRNAs but not by hypoxia-reduced miRNAs in stable HeLa cells expressing Flag-AGO2 under hypoxia (d). Coverage plots showing the abundance of MYC (e) and HMGA2 (f) mRNAs binding to AGO2 by RIP-Seq. g, h Hypoxia increased the accumulation of mRNA transcripts targeted by top 10 non-difference miRNAs (g) and their corresponding 6mer, 7mer and 8mer seed sequences with a single site (h). Cumulative fraction analyses were performed with RNA-Seq data in HeLa-Flag-AGO2 stable cell lines under normoxia and hypoxia. i Hypoxia inhibited the let-7a-miRISC activity. 293T cells were transfected psiCHECK2-4xlet-7a-BS and then treated with hypoxia or CoCl2 (300 μM) for 12 and 24 h. The let-7a-miRISC activity was measured by the dual-luciferase assay. Data were mean ± s.e.m., n = 4 (left panel) or n = 3 (right panel) biologically independent experiments, and P-values were determined by unpaired two-sided t-test. In box plots, the lines represent the median, first and third quartiles, the whiskers denote the minima and maxima; P-values were calculated using a two-sided Mann–Whitney U test for cumulative fraction analysis (a, d, g, h).

