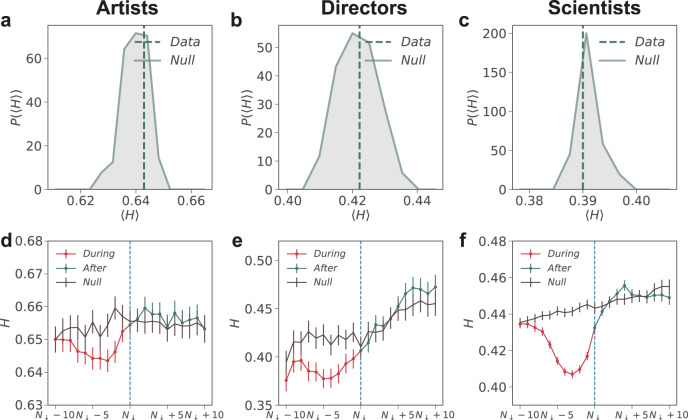
Fig. 5. When hot streak ends.
a–c The distribution of entropy after a hot streak for 1000 realizations of the randomized careers for all individuals analyzed in our datasets. The vertical line indicates measured in real careers, showing that it is statistically indistinguishable from the randomized careers. d–f The dynamics of entropy surrounding the end of hot streaks for real and randomized careers, measured through a sliding window of six artworks, five films, or five scientific papers. Error bars represent the standard error of the mean.

